✨ Minting NFTs: what the onchain data tells us about the primary NFT market.
This article was released with the "Advent of Crypto Data", organized by @notnotstorm at Paradigm. Check other submissions here.
Introduction
Minting is a primary and fundamental interaction with the blockchain within the NFT space. It goes beyond mere blockchain transactions. Historically, NFT mints were perceived as pure speculation mechanisms, but when the market took a downward turn, the act of minting evolved into new immersive onchain experiences that range from media to social actions, marketing campaigns, and so on.
This article is solely about the NFT primary market on Ethereum and our research focused on two main subjects.
First, we look at the mainnet because it has historically hosted the most valuable and sought-after NFTs. Ethereum has earned a reputation as the “NFT value layer”, due to its pivotal work in enabling a new world of crypto applications, beyond the store of value use-case. We will delve into the onchain data to access the current state of the NFT primary market and uncover insights and trends that can shed light on the future of NFT mints, as Ethereum continues to evolve.
Secondly, we delve into the world of Layer 2 EVM networks. These networks have been gaining traction in this year (2023) for several compelling reasons. Primarily because they allow to lower the transaction costs and permit higher network scalability when compared with the mainnet. L2s mark a significant shift in the blockchain landscape, as these solutions allow NFT activity to be significantly more accessible, economically viable and attract a broader audience.
Please note that in our analysis of NFT mints, we have not considered those related to DEXs' liquidity positions (as this one for example). Our methodology was to identify mints associated with DEXs’ liquidity positions with high volume or transactions and exclude them as i) we classify them as part of the DeFi market and not part of the NFT market and ii) would misrepresent the current state of NFT mints, even if they are indeed ERC-721.
NFT Mints on Ethereum
For this article, we’ve created a Dune Dashboard "NFT Mints on Ethereum" to serve as onchain data research material and is available for anyone to consult. Give it a ⭐️ to show your support.
Overview (volume, mints, and users)
For this analysis, we are looking at Ethereum NFT mints over the last 365 days to trace the most updated and current state of the primary market.
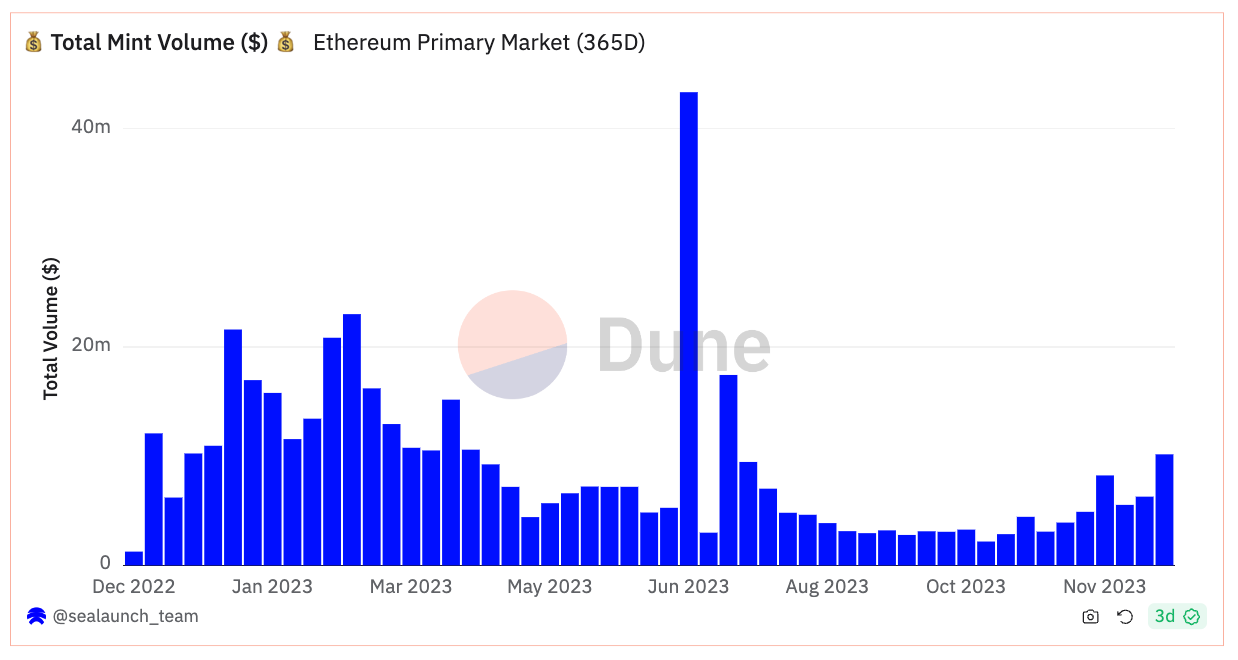
Mint Volume ($)
The overall volume of NFT mints has experienced a noticeable decline from the start of the year and has maintained a low volume throughout the past year.
However, the launch of Azuki Elemental Beans at the end of June has been the year’s notorious exception achieving the highest weekly volume for the entire year and generating over $40 million in volume from the launch.
It’s undeniable that 2023 was a bear market for NFT volume in general, leading many projects to choose to delay launches and opt to wait for more favorable market conditions. This trend shifted towards the end of October. First, the secondary market’s volume began to rise, and second, there was a corresponding (even though shy) uptick in NFT mints’ volume, signaling a renewed interest and activity in the space.
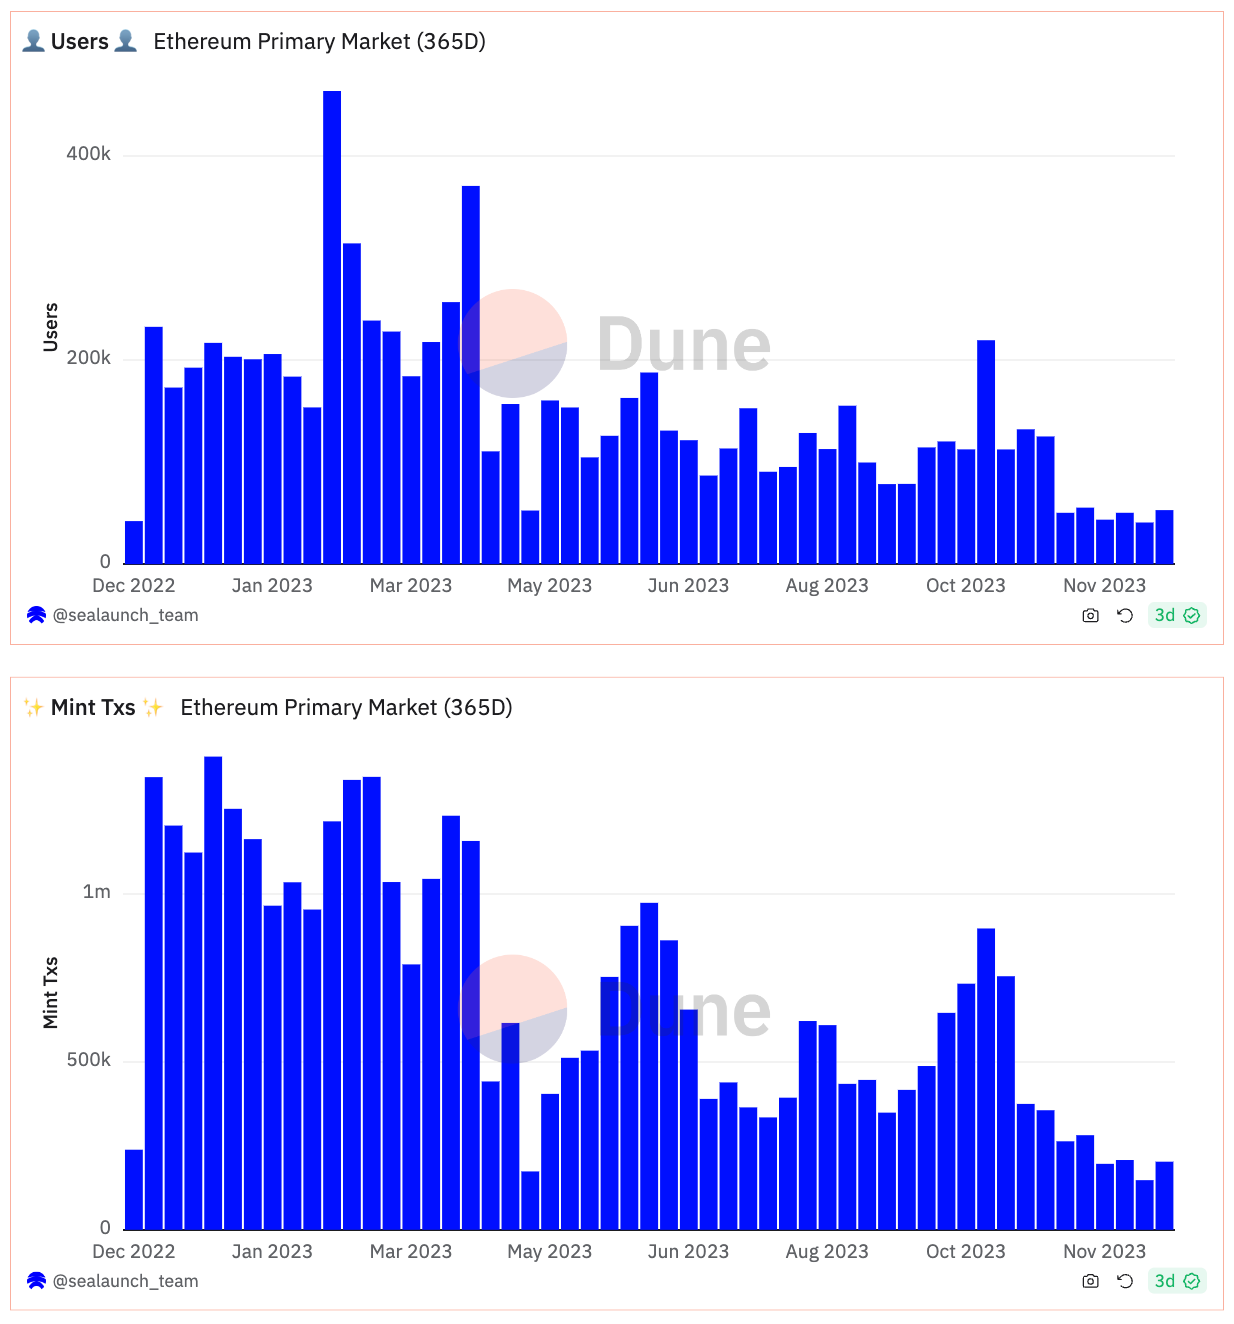
Mint users and mint transactions
When we look at users and transaction activity, NFT mints on Ethereum have sustained a strong appeal throughout the year, despite a slight decline. The onchain data reveals a consistent attraction of many unique wallet addresses minting NFTs. Most weeks saw over 100,000 wallets engaging in minting activities and more than 500,000 NFTs being minted.
Primary vs secondary market
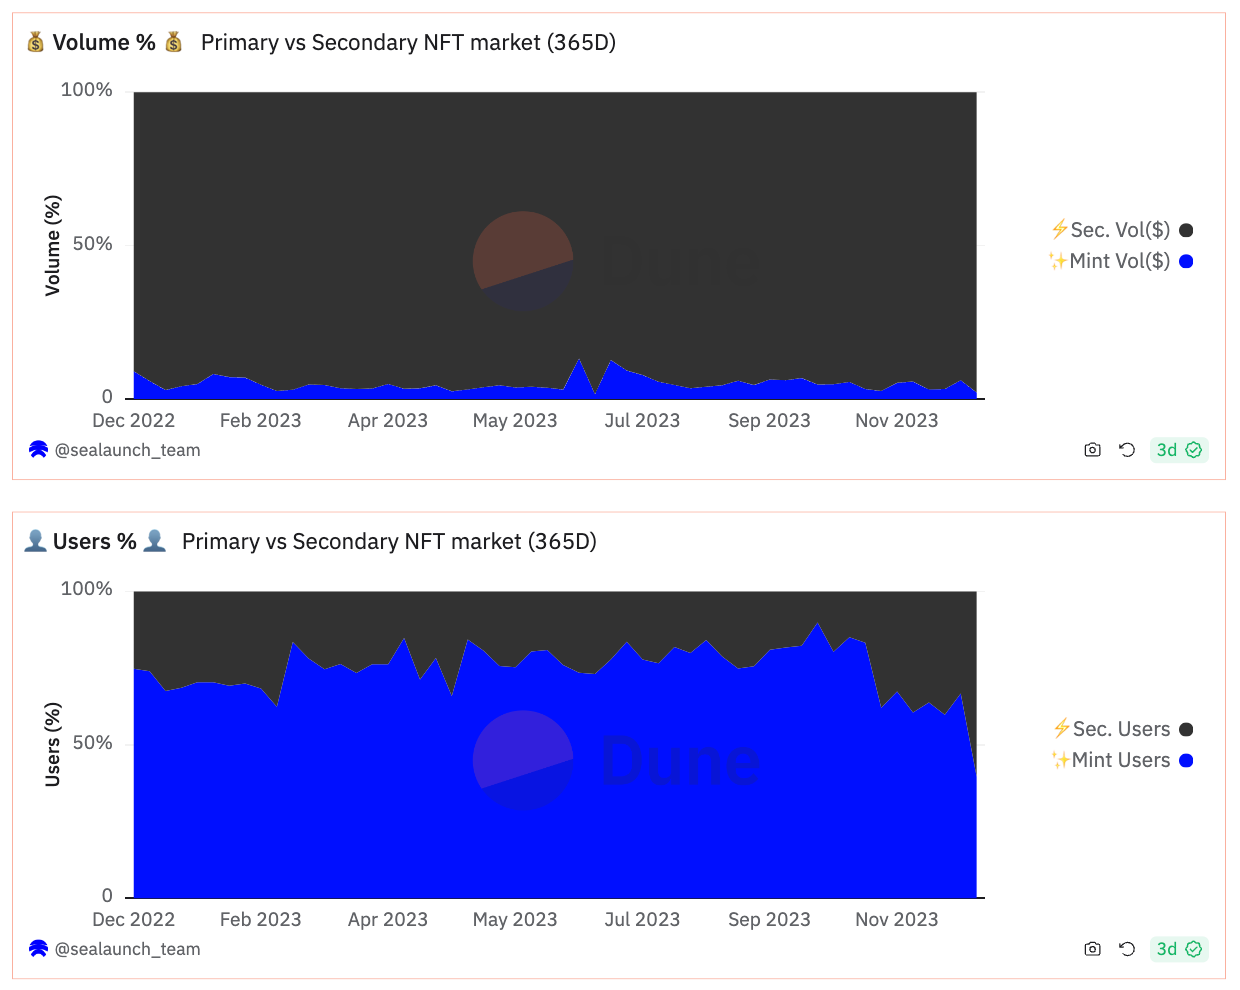
When comparing the NFT primary market (mints) with the secondary market, an interesting trend emerges: while the secondary market captures the majority of the trading volume, consistently accounting for over 90% throughout the year, the primary market sees a higher number of users participating in minting than those engaged in selling on the secondary market (~ more than 70%).
This disparity highlights a unique aspect of user behavior in the NFT ecosystem, with a broader base of wallets actively involved in minting NFTs compared to those participating in subsequent resale activities.
This phenomenon can be explained by the nature of transactions in each market. The secondary market's volume is significantly driven by high-value trades and dominated by power users, who often deal in large sums and are willing to pay a hefty price tag for a digital collectible with cultural or financial resale value. In contrast, the primary market has a mass market appeal, where a wider range of minting values, broadens participants’ pool to a more diverse and larger group of people.
Minting frequency and cadency
Preferred weekdays for NFT minting
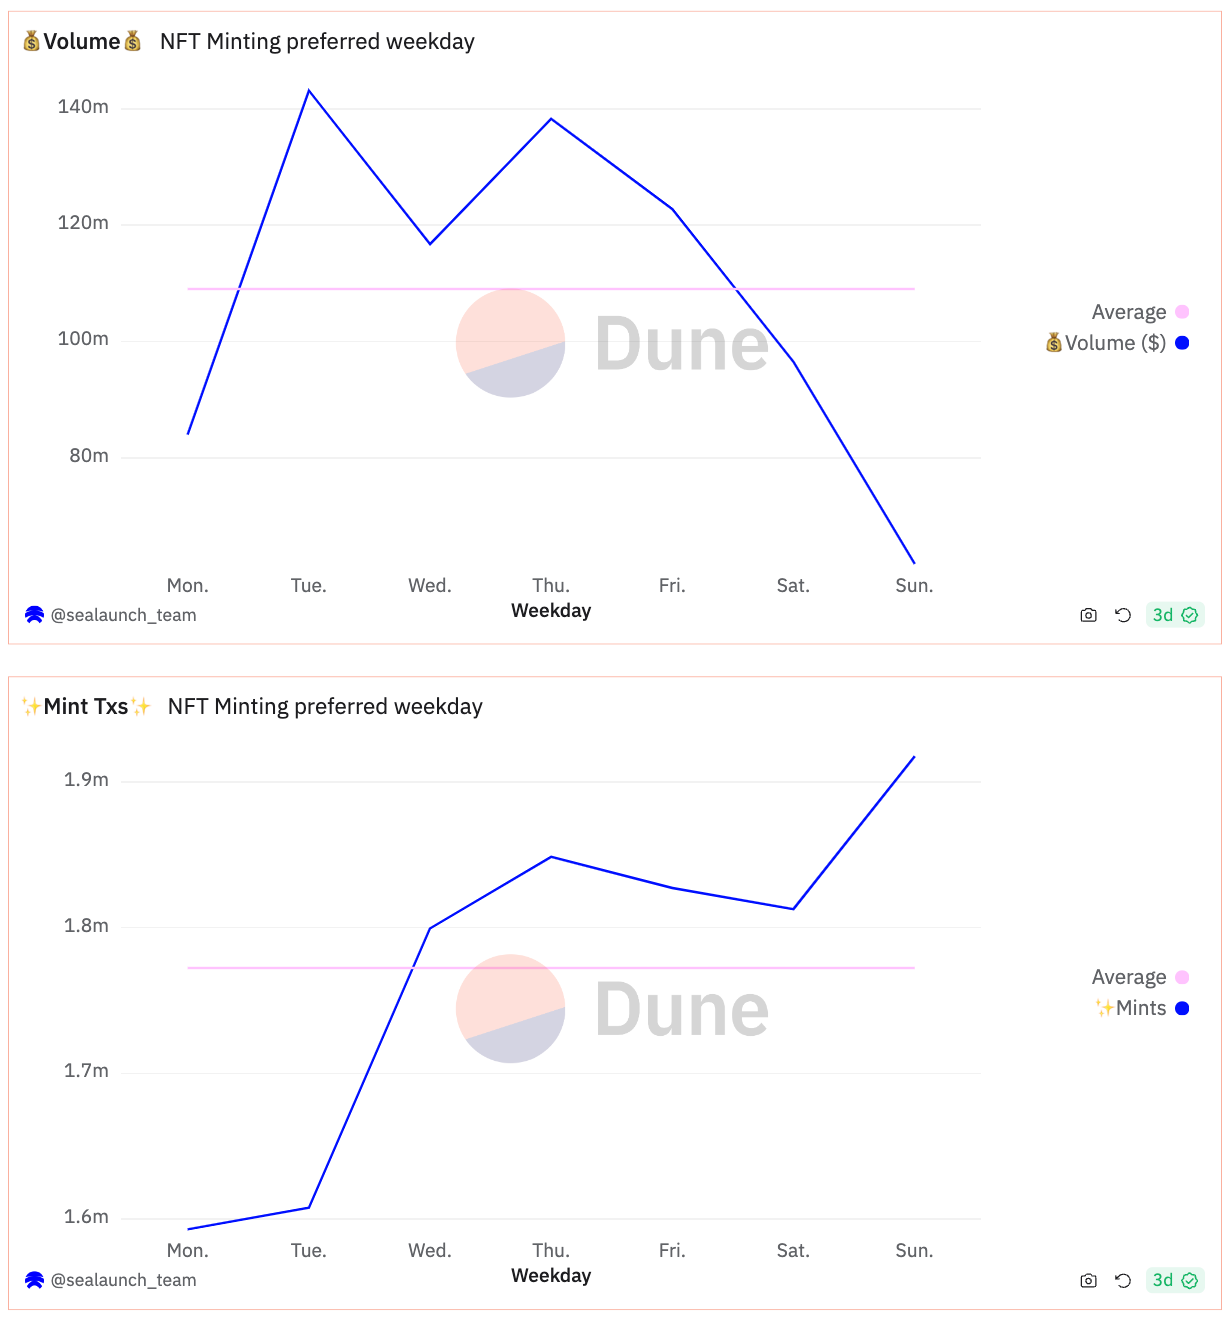
The highest volume of NFT minting is observed midweek, with Tuesday to Thursday standing out as the peak period.
There's a stark drop-off in volume after Thursday, with the weekend, especially Sunday, showing the least amount of NFT minting in terms of volume.
Interestingly, in contrast, the mint transaction pattern starts low at the beginning of the week, and then dramatically spikes towards the end of the week.
Sunday emerges as the top day for the number of mints.
The volume of mints and number of mints seem inversely related, with the peak minting day being midweek, while mint transactions peak on the weekend.
Preferred time of day for NFT minting
There is a pronounced peak in minting volume at around 16:00 UTC, this time is popular for launching NFT mints because it conveniently coincides with key time zones globally, making it an ideal moment for maximum reach. The volume is at its lowest in the early hours of the morning, around 02:00 UTC. A significant increase begins at approximately 13:00 UTC, leading up to the peak hour, after which there is a sharp decline.
NFT mint transactions’ activity exhibits two notable peaks at distinct times of the day. First at around 03:00 UTC and another in the late evening around 21:00 UTC.
There's a big decline in minting activity around 08:00 UTC, where activity drops below the daily average.
The volume of mints shows a single, sharp peak, suggesting a specific time when most users are active in minting NFTs, likely aligned with the end of the workday across Europe and the start of the workday in North America’s time zones.
While minting volume has a preferred time, mint transaction activity suggests users are engaging with the market at multiple points throughout their day, which could reflect global participation across different time zones.
Minting Frequency
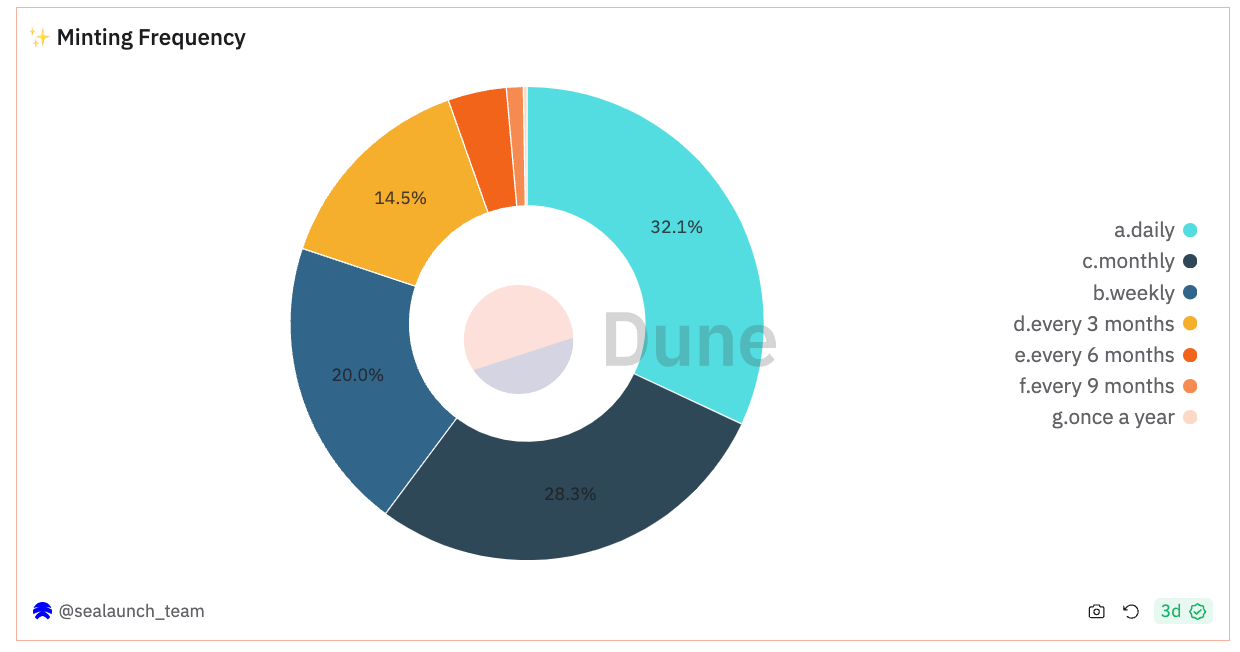
A significant number of wallets engage in minting NFTs on a daily (32%) or weekly (20%) basis, indicating a highly active cohort of users.
Monthly minters account for 28% of wallets, showcasing that a substantial part of the community mints NFTs moderately.
Users that engage in minting only 1 to 3 times annually constitute less than 20% of the total, pointing to a smaller, though still noteworthy, segment of the market participating on a less regular basis.
Average spent per NFT mint
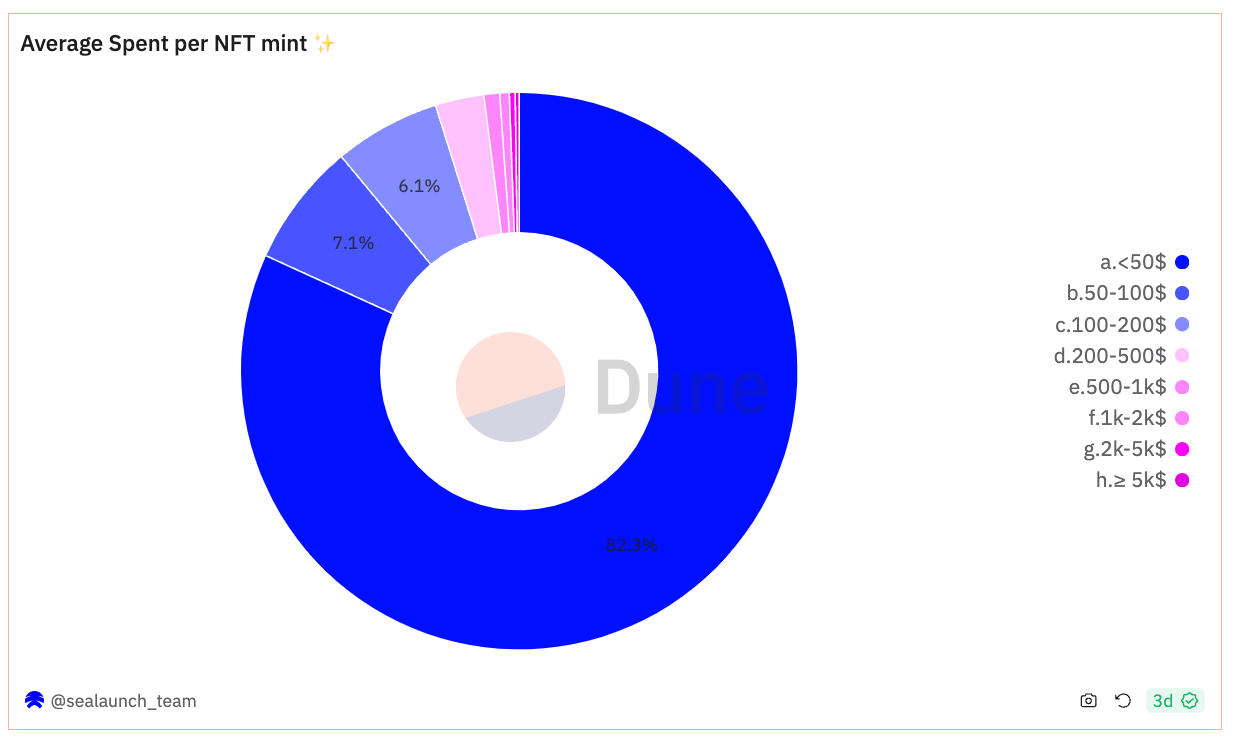
A vast majority of users (more than 82%), spend less than $50 per NFT mint, indicating a significant preference for lower-priced NFTs. This contrasts sharply with higher spending brackets, where the number of users declines steeply as the spending amount increases. For instance, only 7% of users are in the $50-$100 bracket, and this number dwindles further to less than 0,5% of users spending over $5,000.
Total yearly spending on NFT mints per wallet
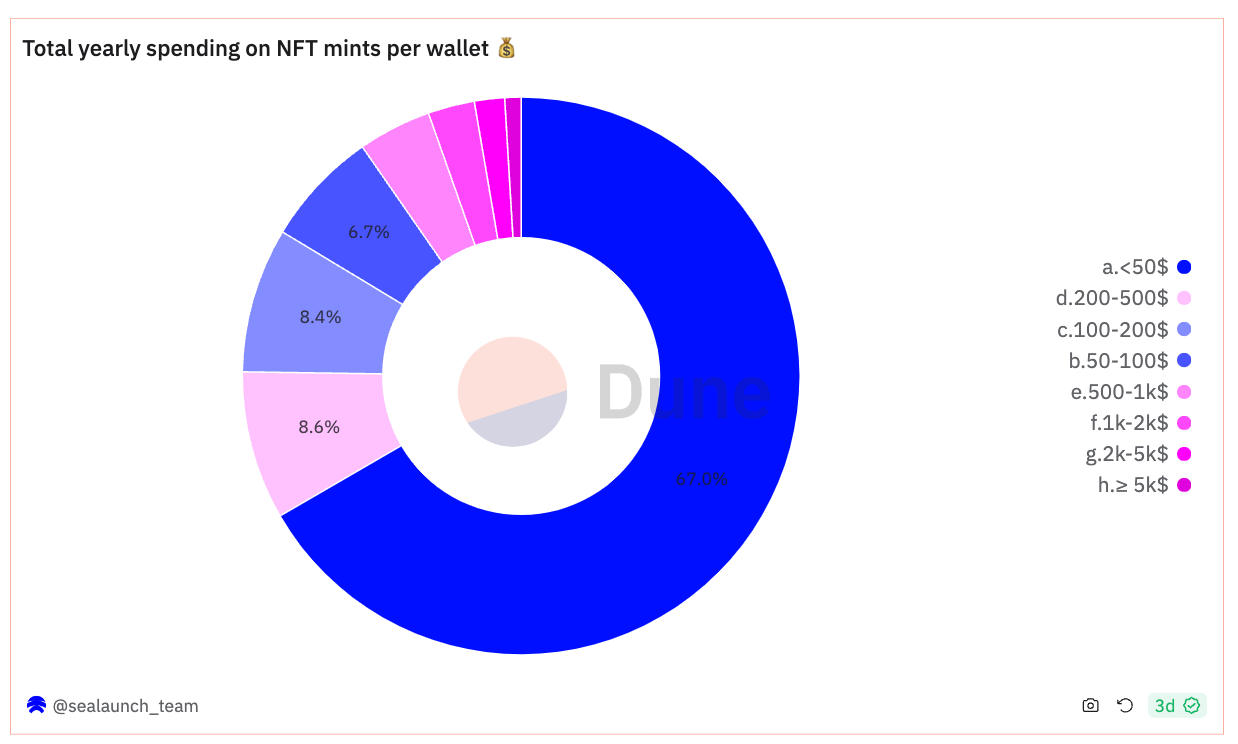
The yearly spending data on NFT minting per wallet presents an insightful distribution. The largest group, comprising 67% of users, spends less than $50 annually.
As the spending bracket increases, the user count decreases, but not as drastically as expected.
For example, the $100-$200 bracket sees 8,4% of users, and the $200-$500 bracket has a similar count of 8,6% suggesting a relevant number of users are comfortable spending mid to high amounts per mint.
The trend shifts significantly in higher brackets, with only approximately 2% of users spending over $5,000 annually.
The onchain data points out modest spending behavior in the NFT market in the last 365 days. A predominantly low-spending majority, followed by a significantly lower cohort of users that is in the mid-range spending bracket ($100-$500) but that account for almost 20% of users.
Minters retention
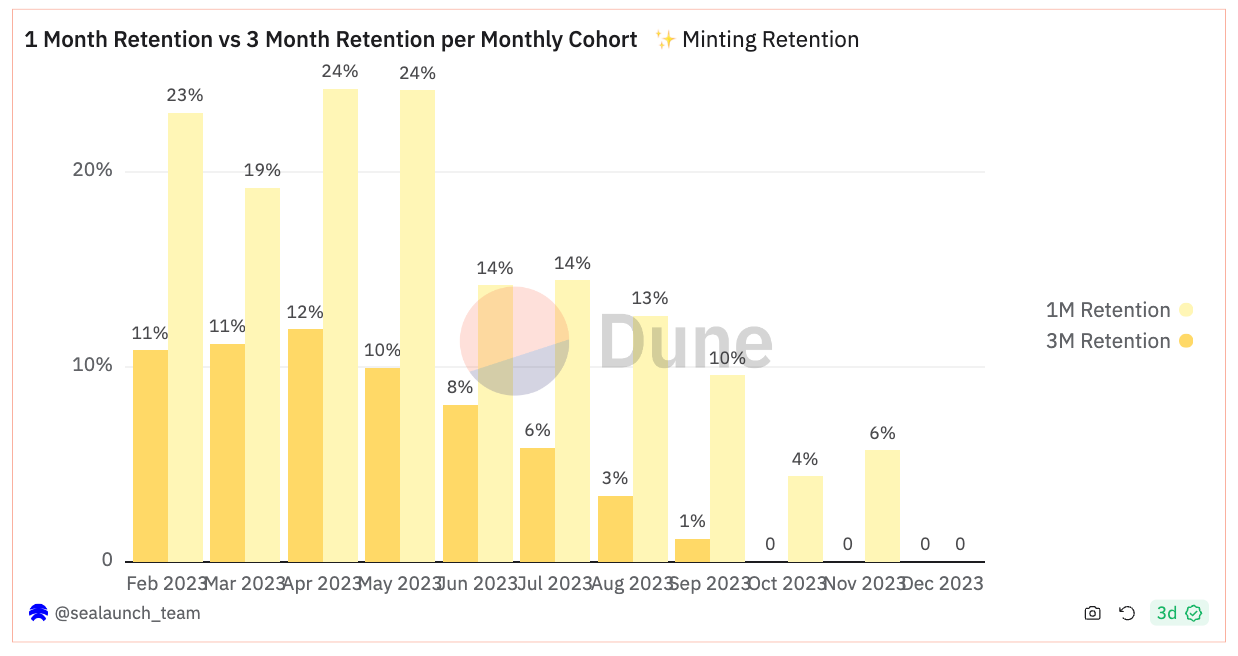
The chart above compares the 1-month and 3-month retention rates of minting activity during the last year for each month cohort.
Retention rates in the first month peaked for the April and May cohorts at approximately 24.3%, suggesting these cohorts had a relatively higher short-term interest in NFT minting.
There's a consistent decrease in retention rates across all cohorts from the first month to the third month, indicating a typical decline in user activity minting on Ethereum.
NFT Mints on layer 2 chains
For this article, we’ve also created a Dune Dashboard "NFT Mints on EVM chains" to serve as onchain data research material and is available for anyone to consult. Give it a ⭐️ to show your support.
We can say 2023 was the year of Layer 2 (L2) chains, due to the surge in L2s deployed throughout the year. These L2s are pivotal in propelling Ethereum's scalability, offering a dual advantage from a consumer perspective: considerably lower gas fees and a reduced barrier to entry for onchain activity. This democratization of access is crucial for widespread adoption.
Moreover, some L2 chains had a clear business development strategy and have successfully attracted traditional Web2 companies to crypto thereby accelerating user adoption across the spectrum.
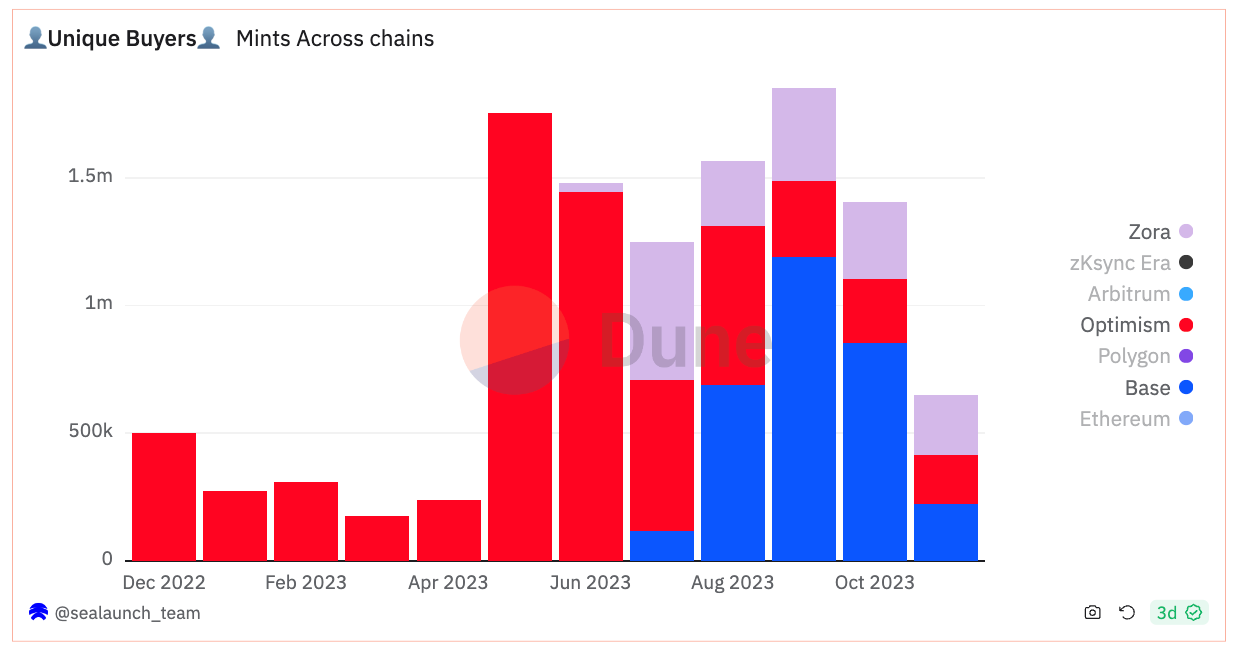
A central growth tactic deployed by L2 chains hinges on the minting of NFTs. For example, the Base’s Onchain Summer campaign in August stands out. It catalyzed the minting of over 700k NFTs, engaging more than 200k distinct wallets. Such strategies underscore the potential of NFTs as a cornerstone for growth and engagement within the onchain universe.
Furthermore, the NFT landscape is transforming, and evolving beyond the realms of community building and speculative trading. We're witnessing a shift towards more engaging and entertainment-focused onchain experiences that offer multifaceted utility. From music NFTs that provide a harmonious blend of art and ownership, to decentralized media platforms reshaping content consumption, and digital fashion pioneering the virtual style frontier — minting is the “genesis” action of all these innovative and emergent use cases.
Taking into account these developments, it becomes essential to examine NFT minting activities across various L2 chains to gain a comprehensive understanding of the market's dynamics. This analysis broadens our market perspective and sharpens our insight into the underlying trends influencing the onchain digital asset space.
Overview (volume, mints, and users)
Mint Volume ($)
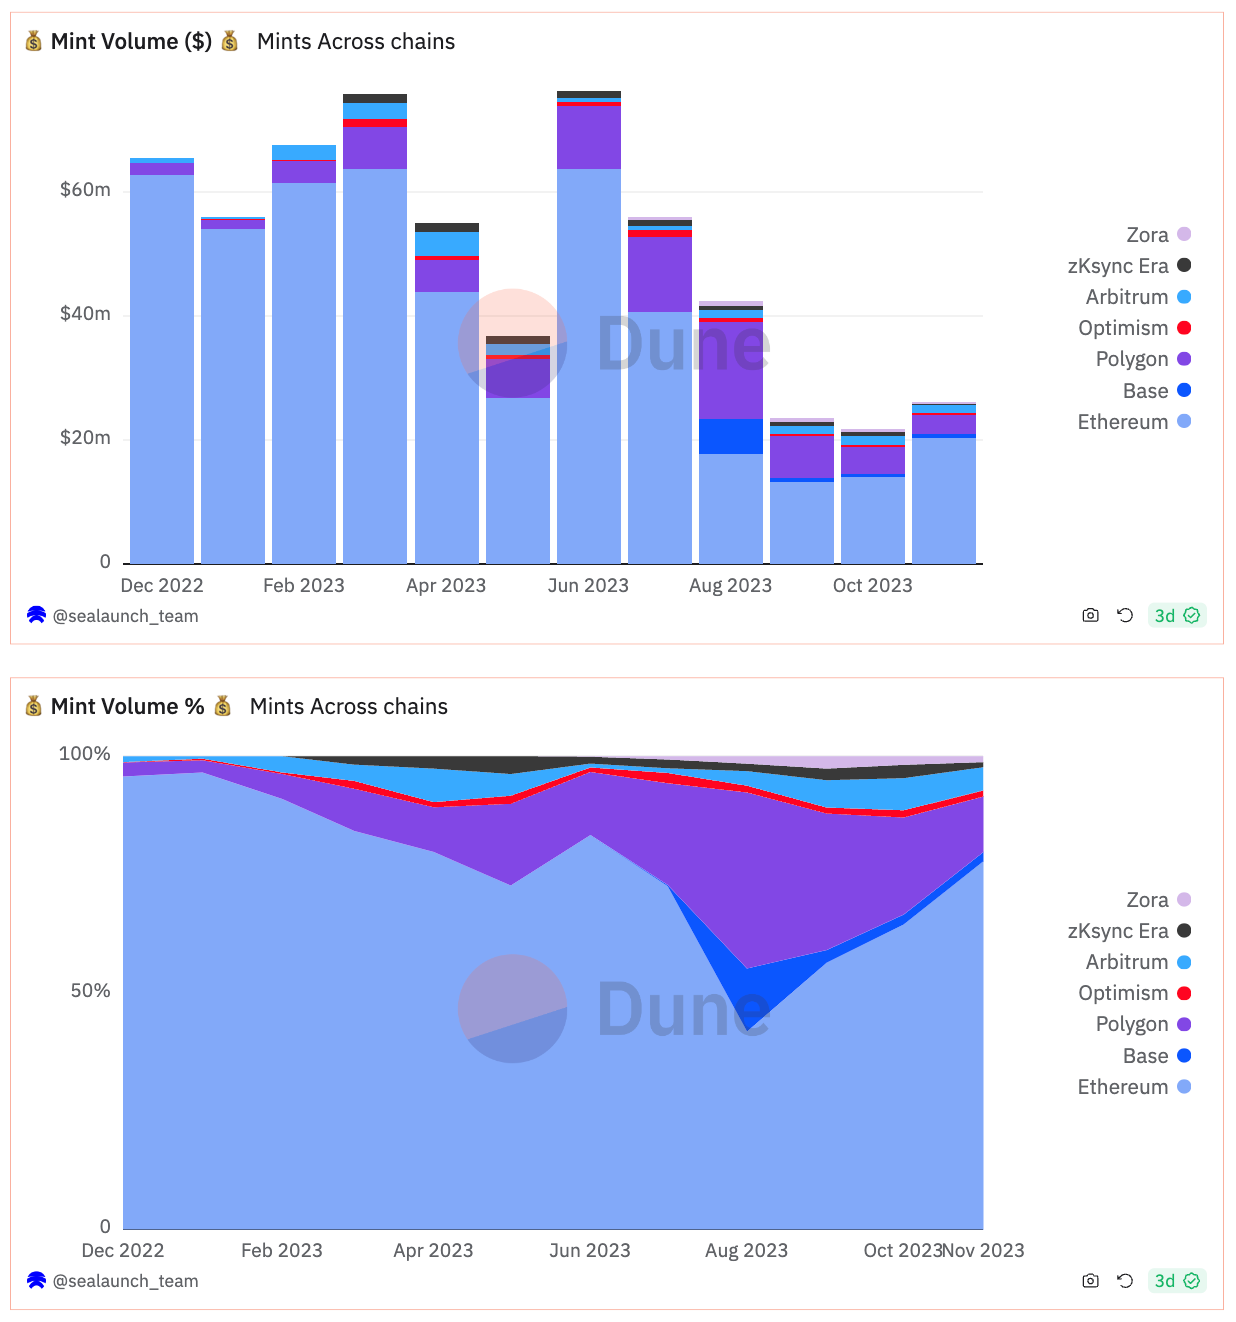
Even though, the majority of mint volume still occurs on Ethereum — averaging 80% over the past year. L2 chains have been gaining traction resulting in a rise in the volume share.
At the beginning of the year, mints on Ethereum accounted for 95% of the total volume. By August this year, mints on L2 chains represented 60% of the overall mint volume, primarily due to the Base’s launch and an increase in Polygon’s volume.
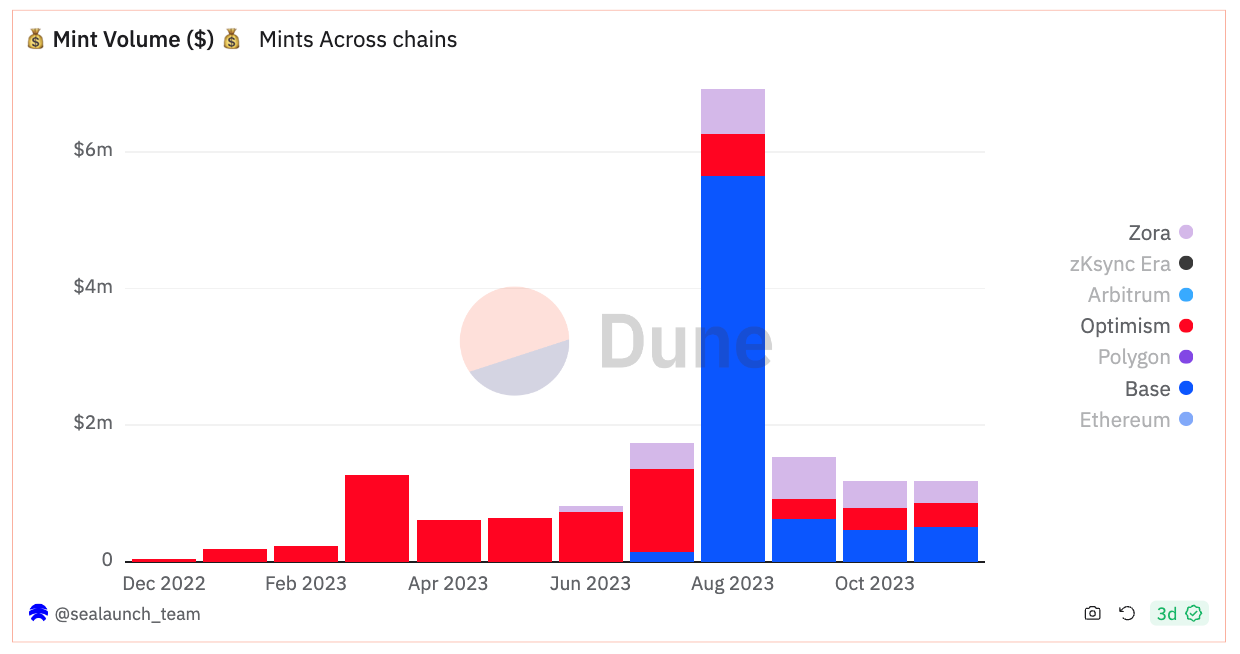
Another emerging pattern is that when an L2 launches, there is typically an increase in mint volume due to launch campaigns. However, in the subsequent months, mint volume tends to decline. This trend is observable to some extent in all the chains that were launched this year.
Number of Mints and users
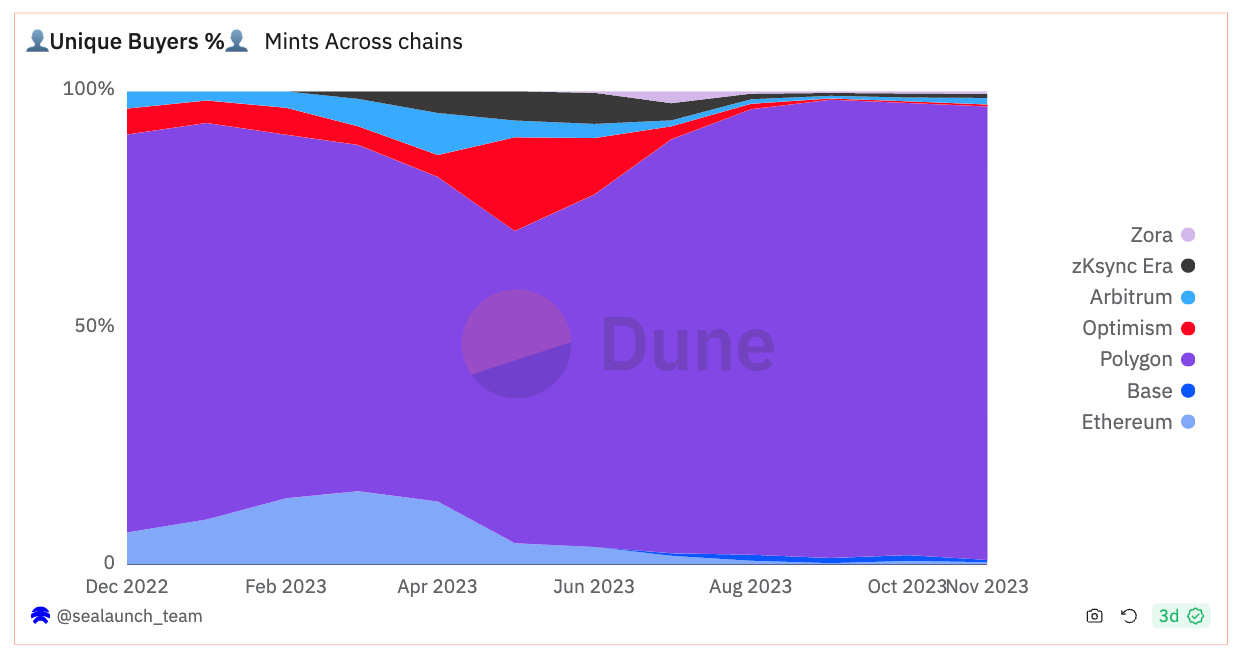
Polygon stands out as the L2 chain with the highest number of mints and users, accounting for approximately 84% of the total NFT mints of the chains being compared.
The projects that gathered more NFT mints on Polygon this year were Planet IX - Assets (Gaming), Galxe OAT (Digital badge), Reddit Starter Pack x Reddit Collectible Avatars (Avatar/collectible), DraftKings Reignmakers PGA TOUR + Reignmakers Football (Sports collectible).
These projects collectively generated an astonishing number of mints, exceeding 88 million NFT mints in total. For comparison, this number is close to the total number of mints that occurred on Base since August, which is the L2 chain with the second-highest number of mints during 2023.
Throughout this year, L2 chains launched on the OP stack superchain (Optimism, Base, and Zora Network) have successfully drawn in a significant user base, consistently surpassing 1.5 million unique minters (users) per month and $1 million in monthly mint volume.
Also, it's noteworthy that Zora Network launched mid-this year, has consistently held the position as the second-highest L2 chain in terms of the number of mints since September. There are more mints per month on Zora Network than on Ethereum, zKsync, and Arbitrum combined.
Free mints vs paid mints
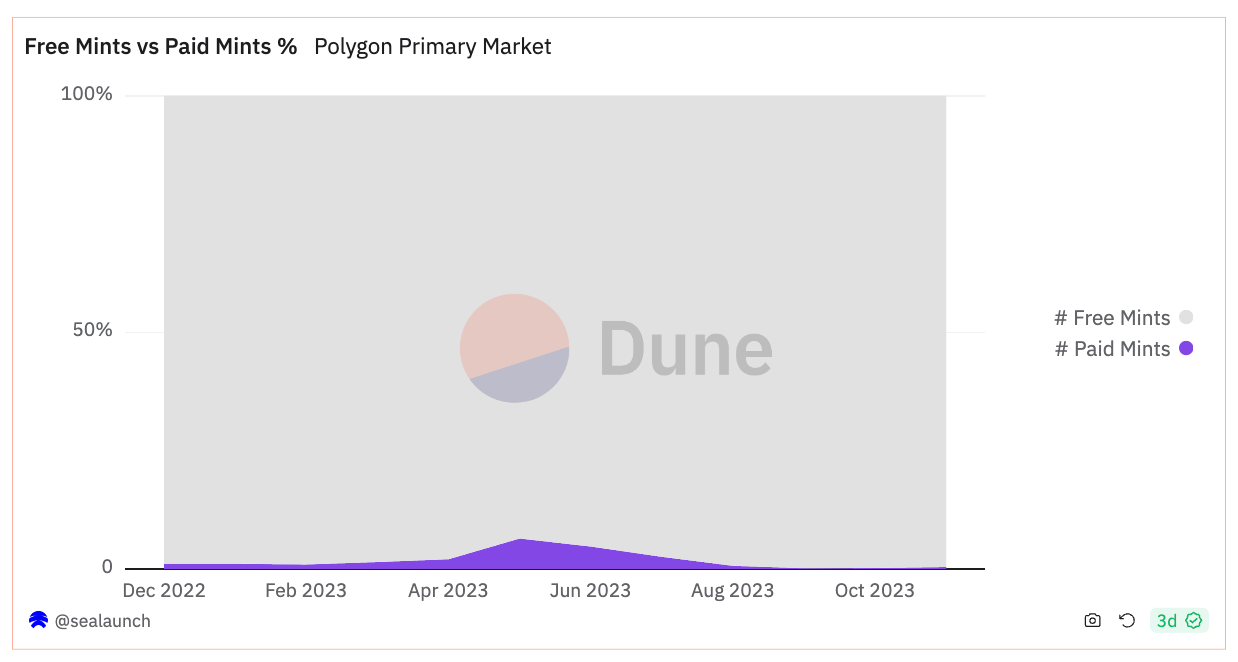
First and foremost, it is worth mentioning that free mints can sometimes be linked to spam transactions, which are typically more prevalent in chains with lower gas fees.
In this context, although there was a general increase in organic free mints, especially during the bear market, the metrics can be distorted by some inorganic activity.
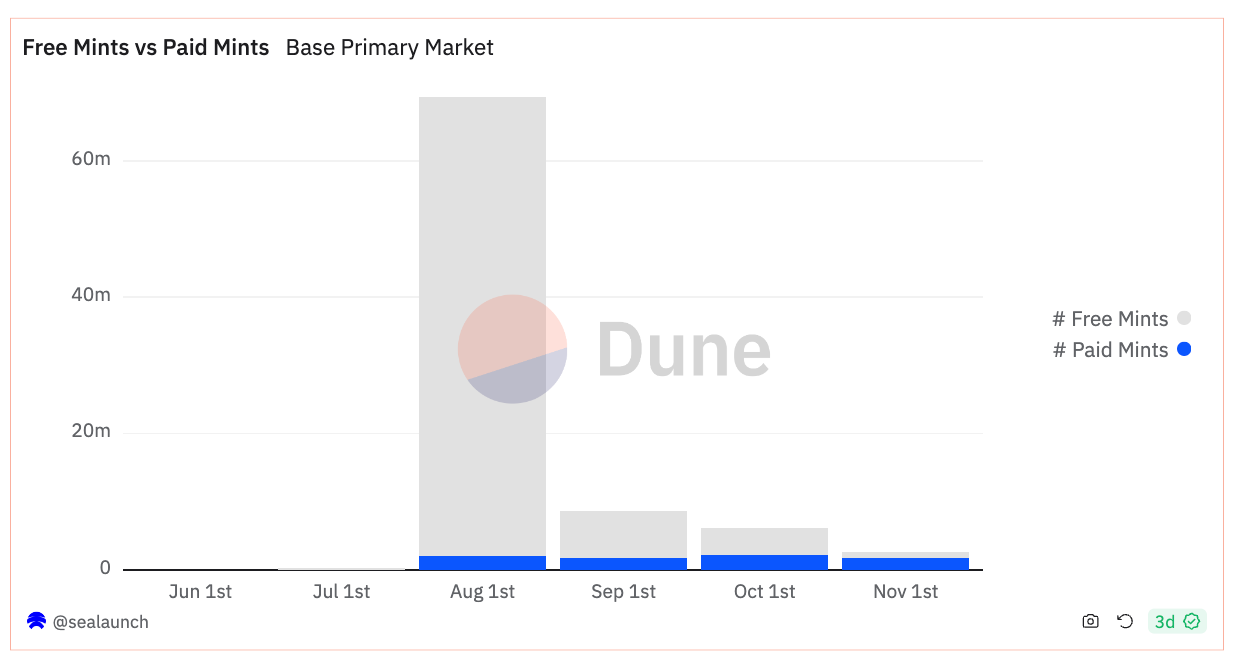
Free mints make up a big part of the minting activity in all chains. About 50% of mints on Ethereum are free, and on Polygon, it's over 90%.
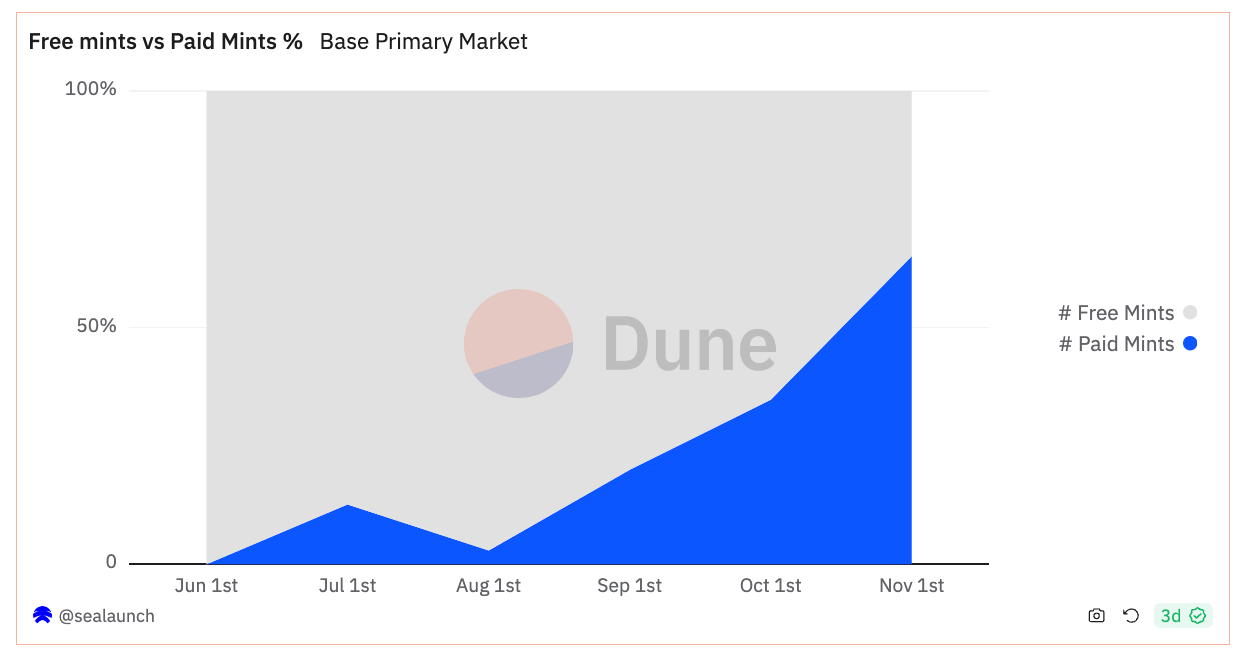
This doesn't imply that all free mints are inorganic. Typically, there is a notable rise in free mints during special mint campaigns or launches (Base's Onchain Summer campaign serves as a good example of this phenomenon).
It is worth noting that there has been an increase in the weight of paid mints on Optimism, Base, and Zora Network. This increase is not due to an uptick in paid mints themselves, but rather a substantial decrease in free mints when compared to previous months.
Noteworthy
The highest volume mint on Ethereum (Azuki Elemental Beans) was associated with a bluechip PFP project, achieving a staggering revenue of over $40 million from a single mint.
Also on Ethereum, ArtBlocks consistently cultivated a substantial community of Art NFT buyers, positioning itself among the top projects in terms of revenue generated through mints.
Consistently across all chains, NFTs related to identity, such as Ethereum Name Services, tend to attract either a high number of mints or significant mint volumes. This trend was also evident with SPACE ID .arb Name on Arbitrum, zkSync Name Service on zkSync, and Zora Name Service on Zora Network.
Polygon successfully attracted companies that launched NFTs on an unprecedented scale, particularly within categories like collectibles and gaming. Typically, these categories can generate a higher number of mints when distributed widely, with a lower price per mint.
Base effectively coordinated large-scale minting campaigns, such as Onchain Summer, and notably drew the participation of non-Web3 companies like Coca-Cola, which launched The Masterpiece Collection, generating over 124 ETH in mint revenue.
Base also succeeded in drawing high-value creators, including DeeKay Motion (New Era ETH/BTC - 714 ETH in mint revenue) and Jack Butcher (Oviators - 183 ETH in mint revenue), who were responsible for generating the highest mint revenues in Base for the year 2023.
Sources:
Dune Dashboard: NFT Mints on Ethereum
Dune Dashboard: NFT Mints on EVM chains
Moving forward
As technology evolves, NFTs are entering an exciting phase, transforming from speculative-only assets to pioneers of unique onchain experiences. From music and digital fashion to social platforms, identity, decentralized media, gaming, collectibles, and digital art, NFTs offer a world of possibilities for creators.
More than ever, NFTs are becoming the heartbeat of creative expression in crypto and are the tool for every creator to explore, experiment, monetize and interact, onchain.✨


