🏴☠️ NFT Marketplaces sea battle 🏴☠️
For the past few months, we’ve been covering NFT marketplaces’ movements on our Twitter, but it made sense to take that exploration further into a long-format article to have a broader view of the space.
NFT marketplaces are gearing up and we can’t help but draw a comparison to the “browser wars” as marketplaces battle over the dominance of the NFT space.
The "browser wars" were a series of intense competitions between Netscape Navigator and Internet Explorer. Netscape Navigator was one of the first popular web browsers, but it was unable to compete with Internet Explorer and eventually lost market share.
The main focus of the competition was market share, and it lasted until the early 2000s when Internet Explorer emerged as the dominant browser. This competition led to rapid innovation in the field of web browsers and the development of many modern features.
There is an incumbent - is OpenSea the Netscape of NFTs? - and a list of challengers of the biggest NFT marketplace to date. Competition fuels discussions between platforms, creators, collectors, traders, and investors and drives innovation and the introduction of new features.
Here are some of the questions that guided our analysis of NFT marketplaces data:
Is OpenSea really losing its market dominance?
Which metrics matter the most for a marketplace’s sustainability?
High-volume trading vs low-volume trading;
Smaller NFT collections vs blue-chip collections;
High-frequency trading vs collectors.
Which strategies (e.g: airdrop, optional royalties, profit sharing, trading rewards, multi-chain expansion) have a meaningful impact in:
Winning market share?
Retaining NFT collections vs Retaining traders long term?
Please note that for this analysis we are using Dune Analytics’ Reservoir data tables focusing on Ethereum NFTs, as of 13 December 2022.
First, the players in this sea battle 🏴☠️
OpenSea, the incumbent.
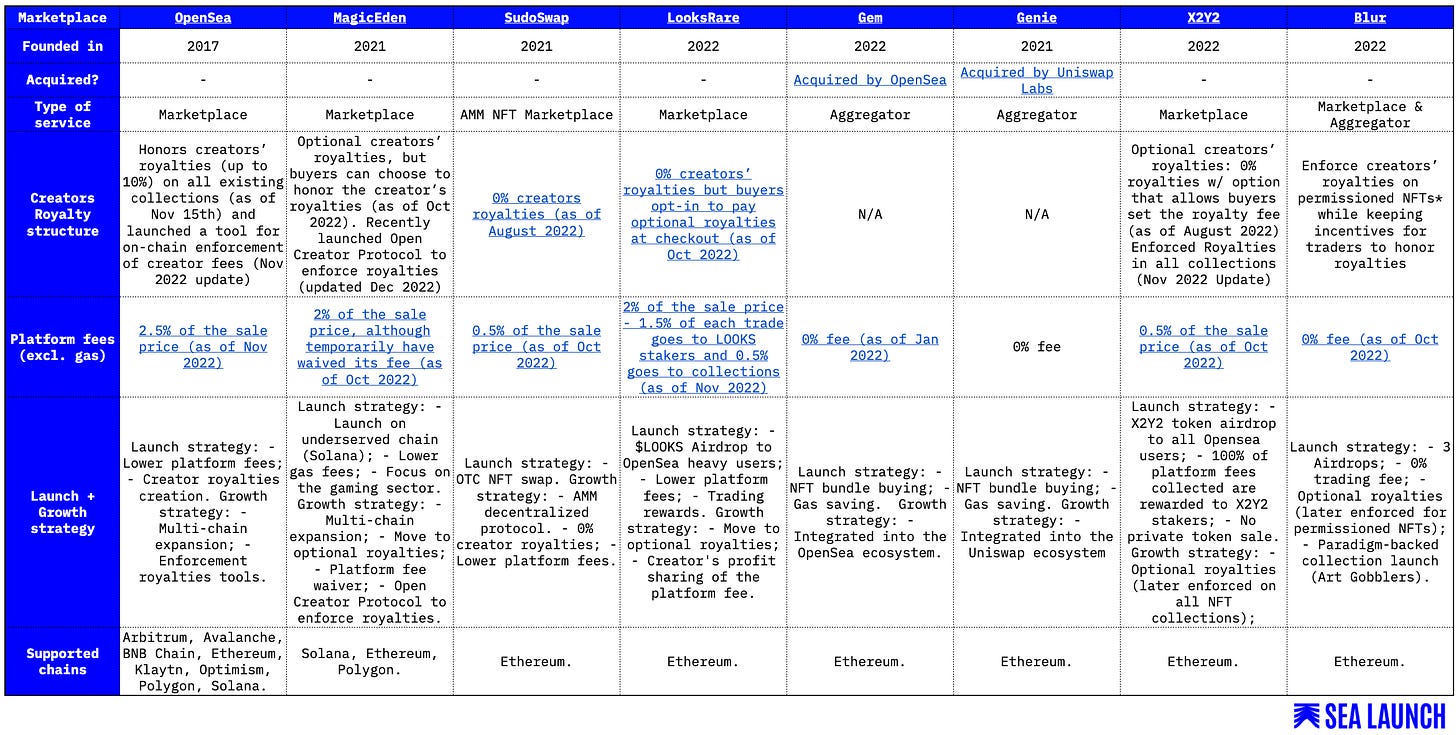
Back in 2017, OpenSea was the newcomer at the height of CryptoKitties’ boom and like many of its challengers today, OpenSea used a pricing strategy to attract NFT users: OpenSea decided to lower and charge a 2.5% trading fee when CryptoKitties charged a 3.5% fee for every sale at the time. Also, important to note that OpenSea’s stance on creators’ royalties since inception:
When the NFT standard was created in 2018, creator fees (sometimes referred to as ‘royalties’) did not exist. OpenSea supported them early to invite more creators into the space, and we hoped at the time that they would be durable. Source.
Today OpenSea is still the biggest NFT marketplace and the one to beat. Since NFTs’ ATH in early 2022, NFT marketplaces have multiplied and each new challenger promises to break OpenSea’s dominance.
The challengers and the strategies to take over the sea.
LooksRare made headlines with $1B in sales volume within a week after launch. The “vampire attack” attracted many users and included:
A $LOOKS token airdrop for OpenSea users who had spent more than 3 ETH in the second half of 2021;
And an incentive structure that plagues the marketplace with a lot of wash trading.
MagicEden went head-to-head with OpenSea for NFT chain dominance. The biggest Solana marketplace made a case for Solana as a lower-cost gas and speedier chain especially when it came to the NFT gaming use case;
Later NFT aggregators like Gem and Genie were pointed as OpenSea challengers. Both aggregators targeted NFT traders by allowing them to buy numerous NFTs in a single transaction, therefore, saving on gas fees.
But, OpenSea acquired Gem in a move to capture the NFT “pro” users and keep its market dominance;
Closely followed by Uniswap Labs with the acquisition of Genie, in a big move by the DEX to ramp up its presence in the NFT space (genie.xyz was discontinued as of November 30th).
More recently X2Y2 - a decentralized NFT marketplace, and Blur - a Paradigm backed marketplace and aggregator, attracted high-volume traders. Both marketplaces followed similar strategies:
Token airdrop:
Optional royalties:
X2Y2 follow suit to keep up with the marketplaces’ trend after SudoSwap - the AMM protocol, became the first zero-royalty platform;
Blur’s airdrop incentive mechanism serves to have traders honor royalties, even though the marketplace doesn’t make creators’ royalties a default option.
Zero or optional royalties fuelled a debate between creators, traders, and marketplaces:
Competing marketplaces like Magic Eden and LooksRare that adhered to the optional royalties policy;
But most importantly, forced OpenSea to have a clear stand on royalties. As a response OpenSea created a contract-level royalty enforcement tool to protect creators’ royalties by blacklisting marketplaces that didn’t honor royalties:
First, only available to new NFT collections;
But due to artists’ backlash, it expanded to all existing collections;
As of November 14th and 18th, Blur and X2Y2 respectively reversed their optional royalties policy to react to OS’ position. Blur will enforce royalties on permissioned NFTs and keep incentives on all other NFTs. X2Y2 applauded OpenSea’s move and will enforce royalties on all collections henceforth.
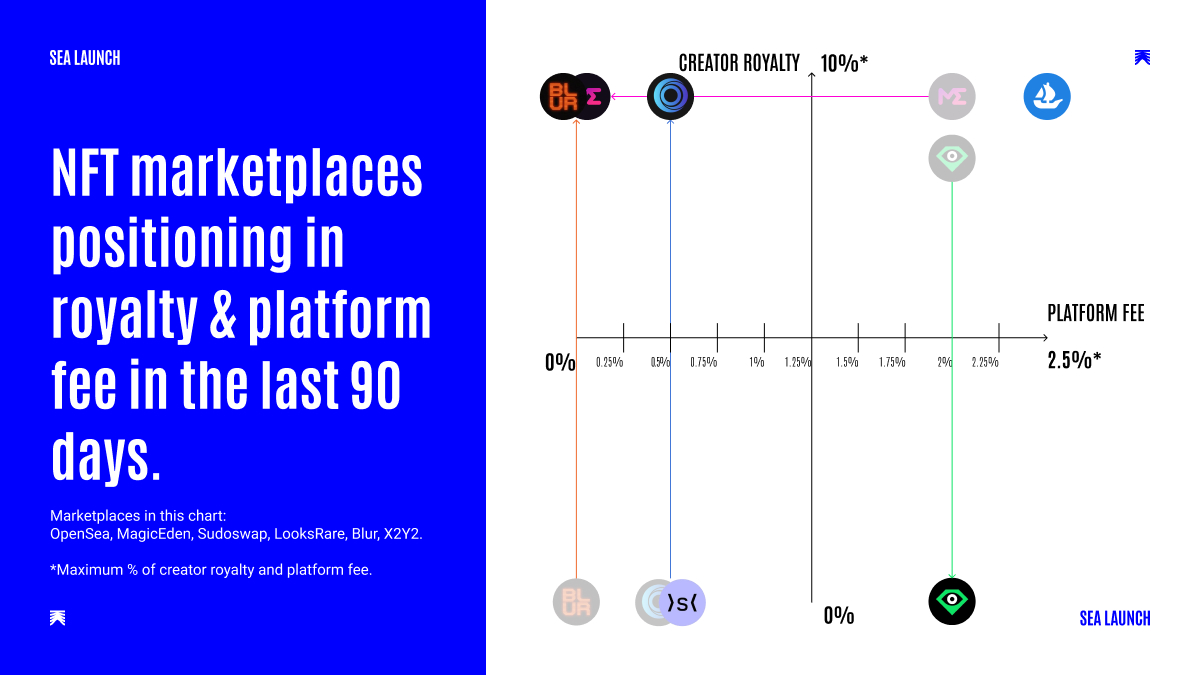
The chart below illustrates the shift in the market position of NFT marketplaces regarding creator royalties and marketplace fees.
Please note other NFT marketplaces that are not mentioned in this article like Rarible, Foundation, or Coinbase NFTs. Additionally, not all marketplaces included in the previous table will be part of the following data analysis (for analytics on smaller NFT marketplaces check our Dune Dashboard).
For clarity we will look at onchain data from the following marketplaces/aggregators: OpenSea, LooksRare, Gem, Genie (now Uniswap NFTs), X2Y2, and Blur. Other smaller NFT marketplaces will be bundled under “other”.
After this lengthy set up, let’s look at what insights we can find in the onchain data.
Is OpenSea really losing its market dominance?
First, we analyze weekly volume in the last 365 days (ETH and %), an important metric to measure the amount of capital flooding (or not) NFT marketplaces:
Key volume insights:
Back in January at the market’s ATH:
OpenSea (~424K ETH) had more than 10x volume than its main challenger LooksRare (~41K ETH);
OpenSea dominated the market with more than ~85% of the volume but had fewer challengers.
LooksRare and Gem’s volume combined (~102K ETH) represent 20% of April’s peak volume (April 25th week) starting to chip away OpenSea’s dominance;
May and June’s best volume weeks in ETH are less than half the ATH week in January, signalling the forthcoming bear market;
In July, overall volume falls almost 90%, but X2Y2:
It’s the 1st marketplace to surpass OpenSea weekly volume (ETH) for 3 consecutive weeks;
X2Y2 takes more than 40% of the market’s volume, opposite to OpenSea's average of 30%.
From August onwards, OpenSea weekly volume (ETH) reaches a plateau, but regains market share (%);
Newcomer Blur started gaining momentum in late October:
Last week of October, Blur had more than double OpenSea’s weekly volume (~92K ETH vs ~ 45K ETH); ****
In November, it surpassed OpenSea’s weekly volume taking ~58% of the market share;
In November, Blur's volume market share (%) is higher than all of the other competing marketplaces combined (excl. incumbent OpenSea);
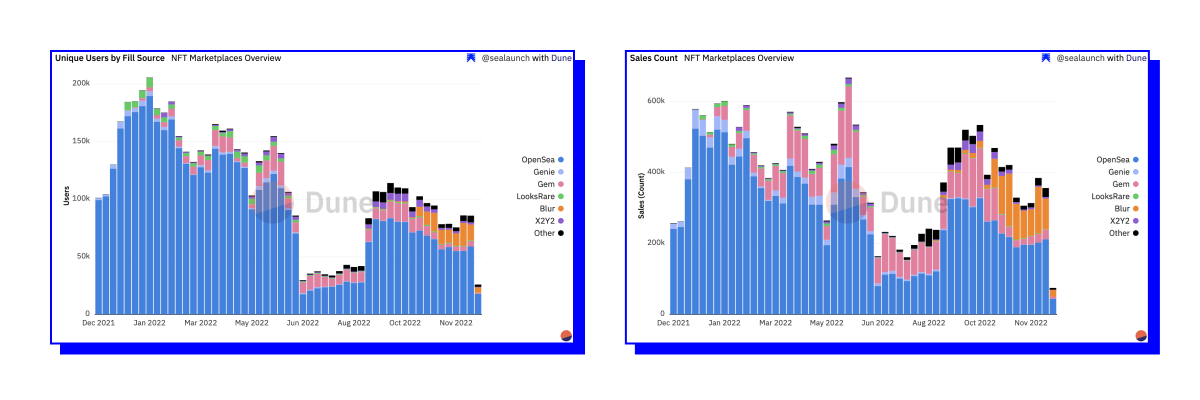
Secondly, we look at NFT marketplaces’ unique users and sales (transaction) count weekly in the last 365 days, because volume metrics alone don’t tell the full story to understand platform adoption.
Key users and sales count insights:
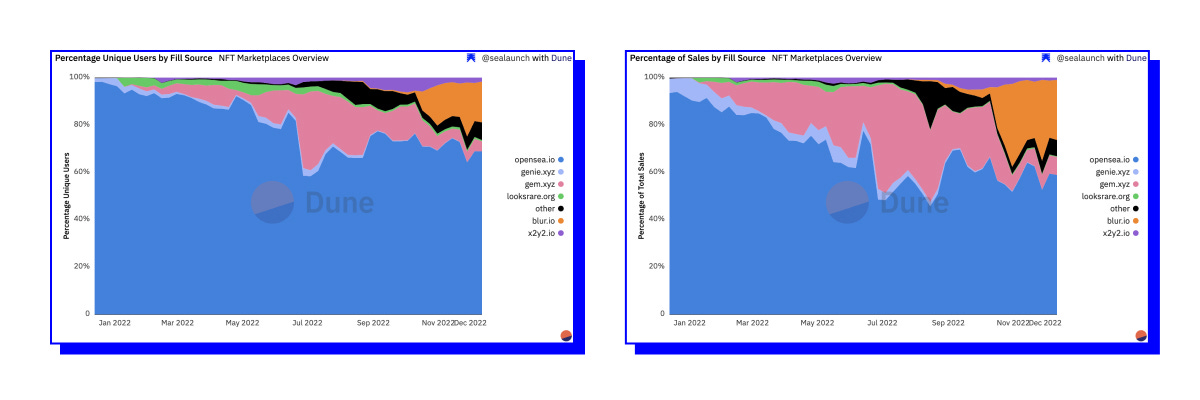
In the first three quarters of 2022, NFT aggregators posed the biggest threat to OpenSea dominance:
In 1st week of January, Genie takes almost 10% of weekly market sales (transactions), but OpenSea is the undisputed leader with 90% of the sales;
Genie is quickly overpassed by competitor Gem which at its peak (July) capture more than 40% of NFT weekly sales surpassing OpenSea*;
Interestingly, Gem was OpenSea's main competitor in the most bearish months (July and August) with:
An average of 20% of weekly unique users;
And an average of 35% weekly sales (transactions) market share.
*Please note that Gem was acquired by OpenSea in April 2022, so technically OpenSea maintained its NFT dominance by acquiring Gem.
In the last quarter, Blur rose as the main OpenSea challenger, and the trend hasn’t changed to date:
Last week of October, Blur captures 35% of weekly sales (transactions) in the space, but please note that Blur launched an optional royalty marketplace that attracted users to its platform;
Since launch (October 19th), Blur has an average 15% unique users market share;
In the November 14th week, when Blur reversed the optional royalty policy to permissioned NFTs, it lost unique users and sales % but bounced back so far;
Both X2Y2 and Gem dropped dramatically in overall weekly unique users since the launch of Blur, the latter is gaining market share from competing marketplaces first then from OpenSea.
Conclusions:
Yes, OpenSea is still the biggest NFT marketplace overall, when considering volume, unique users, and sales data combined;
If in 2021, there were fewer marketplaces capable of challenging OpenSea’s dominance, the same is not true for 2022:
Gem effectively took OpenSea’s market share in terms of volume and sales (transactions);
X2Y2 rose to prominence with the market downfall capturing a large percentage of the market in volume and unique users;
While Blur has shown rapid growth in volume, users, and sales, it mostly gained market share from Gem and X2Y2;
When the market took a downward turn, volume data dropped significantly and it still hasn’t recovered, but other metrics like:
Unique users numbers are picking up, even though far from the 200K mark;
And sales count (transactions) numbers after a dramatic dip (lowest week in at ~160K) have been north of the ~300K mark.
Volume data trend shows that the bear market is here, but a (significant mass) of users is sticking around. The NFT space is more fragmented than before in terms of NFT marketplace preference and intended use. And as NFT artists, collectors, and traders mature, we need to look at more specific usage metrics to understand the different strategies and audiences that competing NFT marketplaces are adopting.
Source: Dune Analytics NFT Marketplaces overview Dashboard
Where are NFT marketplaces charting their course? Volume trading and frequency analysis.
High-volume vs low-volume traders? Key average sale insights:
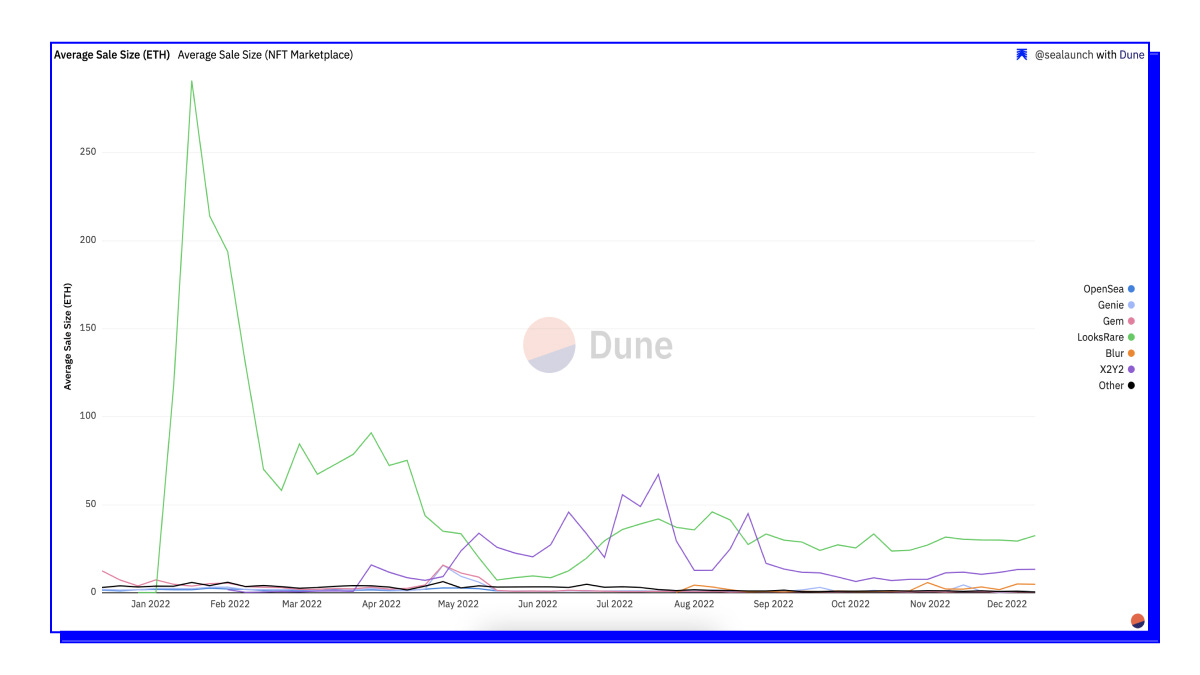
We start by analyzing the average sale size (ETH) per marketplace per week in the last 365D to sense which marketplaces are capturing high-volume vs low-volume traders.
When it launched, LooksRare attracted a high number of high-volume trades, with an average sale size above 100 ETH, influenced by the trading incentives introduced by the platform;
Later on, X2Y2 also attracted high-volume trades, even surpassing LooksRare average sale size between May and August, with an ATH of average sale size of ~67 ETH;
On the other hand, OpenSea’s average sale size is substantially lower than challengers like LooksRare, X2Y2, or even Blur, having its weekly average drop below 1 ETH since July 2022.
But then, when look at the average sale size in the last 90D: we can also perceive that Blur also attracted some high-value trades, with an average sale size between ~2 and 5 ETH.
Source: Dune Analytics NFT Marketplaces overview Dashboard
Key blue-chip trading insights:
Average sale size is highly correlated to blue-chip trading since blue-chip collections are usually highly valuable. NFT marketplaces consider blue-chip traders valuable users since these traders increase overall volume which: i) drives marketplace fees up and ii) increases usage metrics for NFT Marketplaces which is important for external validation. In this context, it makes sense to have a deeper look at how each major NFT marketplace attracts and targets blue-chip trading users.
For this analysis, we considered blue-chip collections the following: CryptoPunks, BAYC, Otherdeed, MAYC, Meebits, Moonbirds, CloneX, and Doodles (this is not an extensive list and more collections could be added to the blue-chip collection concept but this wouldn’t change the underline conclusions).
Weekly volume data shows that OpenSea is increasingly less reliant on blue-chip collections since:
In May of 2022, blue-chip collections represented ~50% of all their volume;
Now, it represents around 20%.
In fact, if we check volume in the last 30 days, we can understand the weight of blue-chip trading across different NFT marketplaces:
So, which marketplaces’ volume is more dependent on blue-chip traders?
X2Y2: 41,2%.
Blur: 34,1%;
LooksRare: 31,5%;
Genie: 29,3%;
OpenSea: 16,9%; and
Gem: 12,8%.
Source: Dune Analytics NFT Marketplaces: Blue-chip vs other collections Dashboard
As stated before, NFT marketplaces’ volume is an important metric because it is a representation of the flow of capital in the market, and it can also be correlated to the monetization strategy since most NFT marketplaces charge a percentage of each sale. Nevertheless, daily unique users is also an important metric to address, because it shows platform adoption.
If we check users’ trading blue-chip collection data in the last 30D:
LooksRare ranks first with 17% of total users trading blue-chip projects;
But, Blur and X2Y2 only have ~4% of their users blue-chip trading;
And on the other hand, blue chip trading represented less than 1% of total OpenSea users.
Source: Dune Analytics NFT Marketplaces: Blue-chip vs other collections Dashboard
Conclusions:
NFT Marketplaces that are very dependant of blue chip trading (in volume and users) may be less resilient because of the dependence of the performance of each of this collections.
Overall, OpenSea’s average sale and volume data shows that:
It is increasingly less reliant on blue-chip collections than most its challengers;
And effectively lost some of its volume market share to LooksRare, Blur, and X2Y2, which attract more blue-chip traders.
Which marketplaces attract high-frequency (pro) traders vs the occasional collector?
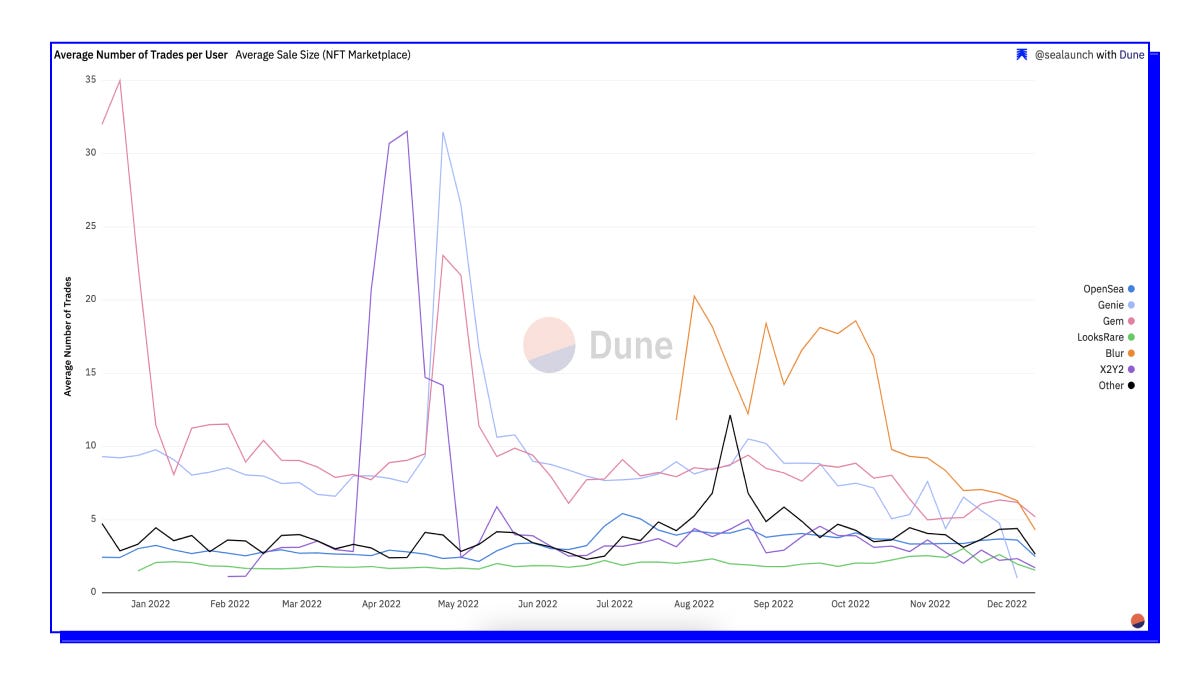
Finally to better understand NFT Marketplace usage, we also analysed trading frequency (ie Average number of trades per user), to get a sense of how much trades each user does in each NFT marketplace.
Key average number of trades insights:
Last 365 days:
Data seems to support that when a new NFT marketplace launches and/or offer high incentives there is a spike in the average number of trades;
Although, almost all marketplaces employed similar strategies, the chart above shows that these strategies are not sustainable long term if not combined with other strategies (or external factors that reflect on onchain data).
If, we zoom in on the last 30 days:
We can conclude that the NFT Marketplaces with the highest average number of trades per user are Gem and Blur (both are NFT aggregators), and the ones with the lower averages are X2Y2 and LooksRare (probably due to loss of market share).
Unsurprisingly, OpenSea attracts more low-volume traders and occasional collectors, since OpenSea is the platform with more DAU, targeting the mass market and with a very consolidated position.
Source: Dune Analytics NFT Marketplaces overview Dashboard
Hypothesis for NFT Marketplaces on the horizon.
Similar to what happened in “browser wars”, where the dominant platform created the industry standard (until a new player came and disrupted the previous model), OpenSea has set the NFT standard in the past when they introduced the concept of creator royalties. This combined with other factors allowed OpenSea to become the biggest NFT marketplace with overwhelming supremacy. Dominance can be an advantage, although it will not guarantee OpenSea’s future success since new players are arriving in the space with new approaches to the market, such no creator royalties, products focused on highly valuable users, trading incentives etc.
How OpenSea adapts and reacts to these new players will establish if they continue as a dominant player or will vanish from existence (similar to Netscape, the first Internet browser with the majority of market share, that was obliterated by Microsoft's free distribution of Internet Explorer).
First of all, new entrants to the NFT Marketplace industry have been using innovative approaches to differentiate from the current incumbent (OpenSea). Several strategies were used such as: zero trading fees, product innovation (e.g: aggregators’s bundle NFT buying saves traders gas fees), trading token incentives, AirDrops, revenue sharing platform (e.g: X2Y2), zero or not enforced creator royalties (which ended up as a backlash), partnering with NFT traders and influencers, etc.
In the NFT context, other innovative strategies inspired from the Web1 or Web2 can be employed to try to dethrone the incumbent. One hypothesis would be the Freemium model, the pricing strategy where the heavy users pay for PRO features, but the majority of users enjoys zero trading fees. Product development could focus on Pro features that cater to high-frequency and high-volume traders, usually more willing to pay for an edge or for bundle service such as market intel services or a launchpad/alpha access.
Another hypothesis, it’s a monetization model where NFT marketplaces combine a fixed amount fee per sale with a (lower) percentage of each sale. This type of strategy is normally used in stock trading brokerage services and typically used for a mass market approach, for this reason, would fit better on NFT Marketplaces that have a higher number of transactions (such as OpenSea or Blur).
On another hand, as previously mentioned, Blue-chip collections represent a high percentage of the total NFT market volume. In this sense, NFT “conglomerates” such as Yuga Labs (owner of some of the biggest NFT collections including BAYC, MAYC, BAKC, Otherdeed for Otherside, CryptoPunks, Meebits and 10KTF) are in an interesting position to launch their own NFT Marketplace and can even incentivize usage with an ecosystem token (such as ApeCoin). In theory, Yuga could enforce at the contract level the usage of its own NFT Marketplace (even though this would be against the decentralization of the ecosystem). Recently, ApeCoin DAO launched a community-driven NFT marketplace that hasn’t yet attracted substantial volume but marks a first move in this space.
In the creator royalties setting, OpenSea (reactively) developed an on-chain enforcement tool of creator fees that effectively backlists zero-royalty marketplaces. But, this enforcement tool opened a pandora's box, where in the future NFT marketplaces can negotiate (and then enforce onchain) exclusive partnerships with certain upcoming collections. In practical terms, certain hyped NFT collections could only be available in exclusivity in a specific NFT Marketplace (similar to what happens with some TV shows on streaming platforms such as Netflix). Again, this would be against decentralisation of the industry but can be used as a differentiator by NFT Marketplaces.
In conclusion, NFT Marketplace industry is at a high competition stage, which will drive fast pace innovation. All the new players have the objective of taking down part of the market share of the incumbent (OpenSea) and will test new innovative approaches from a product, pricing, or growth perspective to achieve this. But bear in mind that OpenSea still has lots of cards on its sleeve that can use if it is highly threatened, since OpenSea i) never lowered trading fees, ii) never launched a token, iii) never created incentives to trading.
We will continue to keep an eye on the NFT Marketplaces sea battle. 🏴☠️
For this analysis we used the following Dune dashboards:
NFT Marketplaces overview
NFT Marketplaces - Blue-chip vs Other Collections
NFT Up and Coming Marketplaces


