OpenSea vs Blur - What’s the preferred NFT Marketplace of the Top 1%?
Before you begin exploring this article, please take a moment to follow us on Twitter.
Following our Deep Dive into the NFT Marketplaces war, we decided to do a short article focused on the incumbent (OpenSea) and its main contender (Blur).
Blur launched targeting NFT pro users, took the industry by storm and was able to gain a significant percentage of the volume marketshare (almost 80% at the ATH).
Blur's success can be attributed to an aggressive multi-phase airdrop strategy that effectively generated trading incentives, leading to an increase in trading volume for the platform. However, this approach did not yield a proportional growth in user acquisition.
In hindsight, this strategy attracted the users that trade more volume on the NFT market. For example, machibigbrother was actively trading on Blur (sometimes at a loss) and end up receiving ~1.8M $BLUR from Blur Airdrop.


In order to gain a deeper understanding of the user landscape of OpenSea vs Blur, we analysed the distribution of volume, trades, and buyers that stem from distinct user groups on each platform:
Top 1% NFT Traders (Volume in $USD);
Top 5% NFT Traders (Volume in $USD);
Top 10% NFT Traders (Volume in $USD);
Normal User (all the other users).
Please note that for this analysis we are using Dune Analytics’ nft.trades data tables and Dune labels. We are focusing on the last 3 months and using the following Dune dashboard:
📊- OpenSea vs Blur - What’s the preferred NFT Marketplace of the Top 1%?
Volume
First, when we analyse the distribution of the volume of OpenSea and Blur according to these user categories, the difference is clear.
OpenSea:
- Most of OpenSea volume ~62% comes from Normal users.
- Top 1% NFT traders account for 22,9% of volume.
Blur:
- Most of Blur volume ~66% comes from Top 1% NFT traders.
- Normal users account for 20% of volume.
Trades (sales)
Secondly, we look deeper at the number of trades (sales) of OpenSea and Blur according to these same user categories.
OpenSea:
- Most of OpenSea trades ~80% come from Normal users.
- Top 1% NFT traders account for 9,4% of trades.
Blur:
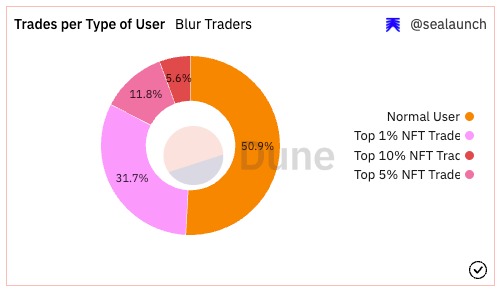
- Most of Blur trades ~50,9% comes from Normal users (a difference of ~30% compared to OpenSea).
- Top 1% NFT traders (31,7%) + Top 5% NFT Traders (11,8%) account for 43,5% of total trades.
Buyers (users)
Lastly, we analyse the buyers (as a proxy of number of users) according to the same user categories.
OpenSea:
- Most of OpenSea buyers ~88% are Normal users.
- Top 1% NFT traders are ~4% of buyers.
Blur:
- Most of Blur buyers ~72% are Normal users (a difference of ~16% compared to OpenSea).
- Top 1% NFT traders (12,9%) + Top 5% NFT Traders (9,5%) account for 22,4% of total buyers.
Key Takeaways:
OpenSea's volume is predominantly driven by normal users (~62%), while Blur's volume comes primarily from the Top 1% NFT traders (~66%).
Top 1% NFT traders account for a higher percentage of sales on Blur (31,7%) than on OpenSea (9,4%).
A bigger percentage of OpenSea buyers are Normal users (88%) when comparing to Blur (72%).
Top 1% NFT traders account for a higher percentage of buyers on Blur (12,9%) than on OpenSea (4%).
In summary, Blur's platform sees a higher concentration of activity from the Top 1% NFT traders, while OpenSea's volume and user base are primarily driven by normal users. The proportion of Top 1% NFT traders among users is also higher for Blur compared to OpenSea.
If you enjoyed this article, help us out by sharing it! 🤌


