


🚀 Outliers vs 🪦 Dead NFTs in this bear market.

After a very long hiatus, sealaunch is back in your inbox. From now on, we will try to write more regularly, but without making any promises. We can promise that we will always try to bring insightful deep dives into NFTs and DAOs with the help of on-chain data.
Without further ado and in the Halloween/Day of the dead spirit, here’s our latest deep dive.
No time to read a long article, skip to TL;DR at the end of the e-mail.
Are NFTs dead?
We’ve seen multiple articles with this running title since the NFT market volume plummeted mid-May. Is there any truth in this question?
Volume is often the most used metric to evaluate the NFT market’s health, so if we look at the largest NFT marketplace’s volume data of the last 4 months, it’s clear that Opensea’s volume has plateaued out after an ATH of 478 ETH in January and a peak of 370 ETH in the last week of April.

Opensea’s volume data corroborate that we are currently going through an NFT bear market. But even under these conditions, Opensea holds the 2nd position based on cumulative revenue for the last 90 days at ~$30M, only surpassed by the Ethereum blockchain itself.

The Token Terminal’s chart above asserts Opensea as one of the biggest revenue-generating companies in web3, also its dominance in the NFT space. Check our mini thread on it for more insights, but one thing is safe to say: the NFT market is not dead when seeing through the lens of volume.
Nevertheless, these are bearish times, so we decided to look at NFT data to have a picture of the current state of all those NFTs that flooded the Ethereum blockchain since the NFT summer.
Some questions that guided this analysis:
How many NFTs completely failed? (Fail = 0 to 5 ETH all time volume)
What is the current state of NFTs that launched? (Launched ≧ 5 ETH all time volume)
How many NFTs are now dead? ( Dead = 0 ETH volume last 30D)
How many NFTs are outliers in the current bear market? (Outliers >2K ETH volume last 30D)
What insights emerge from the outliers NFTs and their opposite - the dead NFTs?
Please note that for this analysis we are using Dune Analytics’ Reservoir data tables focusing on Ethereum NFTs, as of 1 November 2022.
We start with the gloomy side NFT volume data.
Failed NFTs: projects that never sailed away.
From the sheer amount of upcoming NFTs on Ethereum announced daily since NFT summer, it was expectable that a large number would likely fail to even have any type of volume.
Notes to better understand the following Dune Analytics’ charts:
We consider a failed NFT, a project with insignificant volume from 0 to 5 ETH all time volume;
We consider a launched NFT, a project with relevant volume > 5 ETH all time volume.

The reality is that 74.3% of NFT collections failed (Fail = 0 ETH all time volume).
Fierce competition can be one among multiple factors that combine or individually can explain the distribution in the chart above. Other contributing factors that we still identify in upcoming projects are poor strategies like artificially inflating their socials, mediocre derivative art of a successful project, lack of a meaningful vision or value proposition, non-credible teams or even, realistic roadmaps. Finally, let’s not forget all the opportunist players with their painfully obvious scams.
So, let’s turn to the 25.7% NFT collections that successfully launched (> 5 ETH All time volume) to see how these collections are performing.
The state of launched NFT projects.
Before we start, notes to better understand the overview charts that follow:
We are excluding the failed NFT projects (0-5 ETH all time volume) from the charts below;
We consider a launched NFT, projects with relevant volume ≧ 5 ETH all time volume;
We divided launched NFT projects into tiers according to their volume of the last 30 days:
Dead NFT project = 0 ETH volume;
Zombie NFT project = 0 to 5 ETH volume;
Alive NFT project = 5 to 50 ETH volume;
Surviving NFT project = 50 to 150 ETH volume;
Thriving NFT project = 150 to 2000 ETH volume;
Outlier NFT project > 2000 ETH volume.
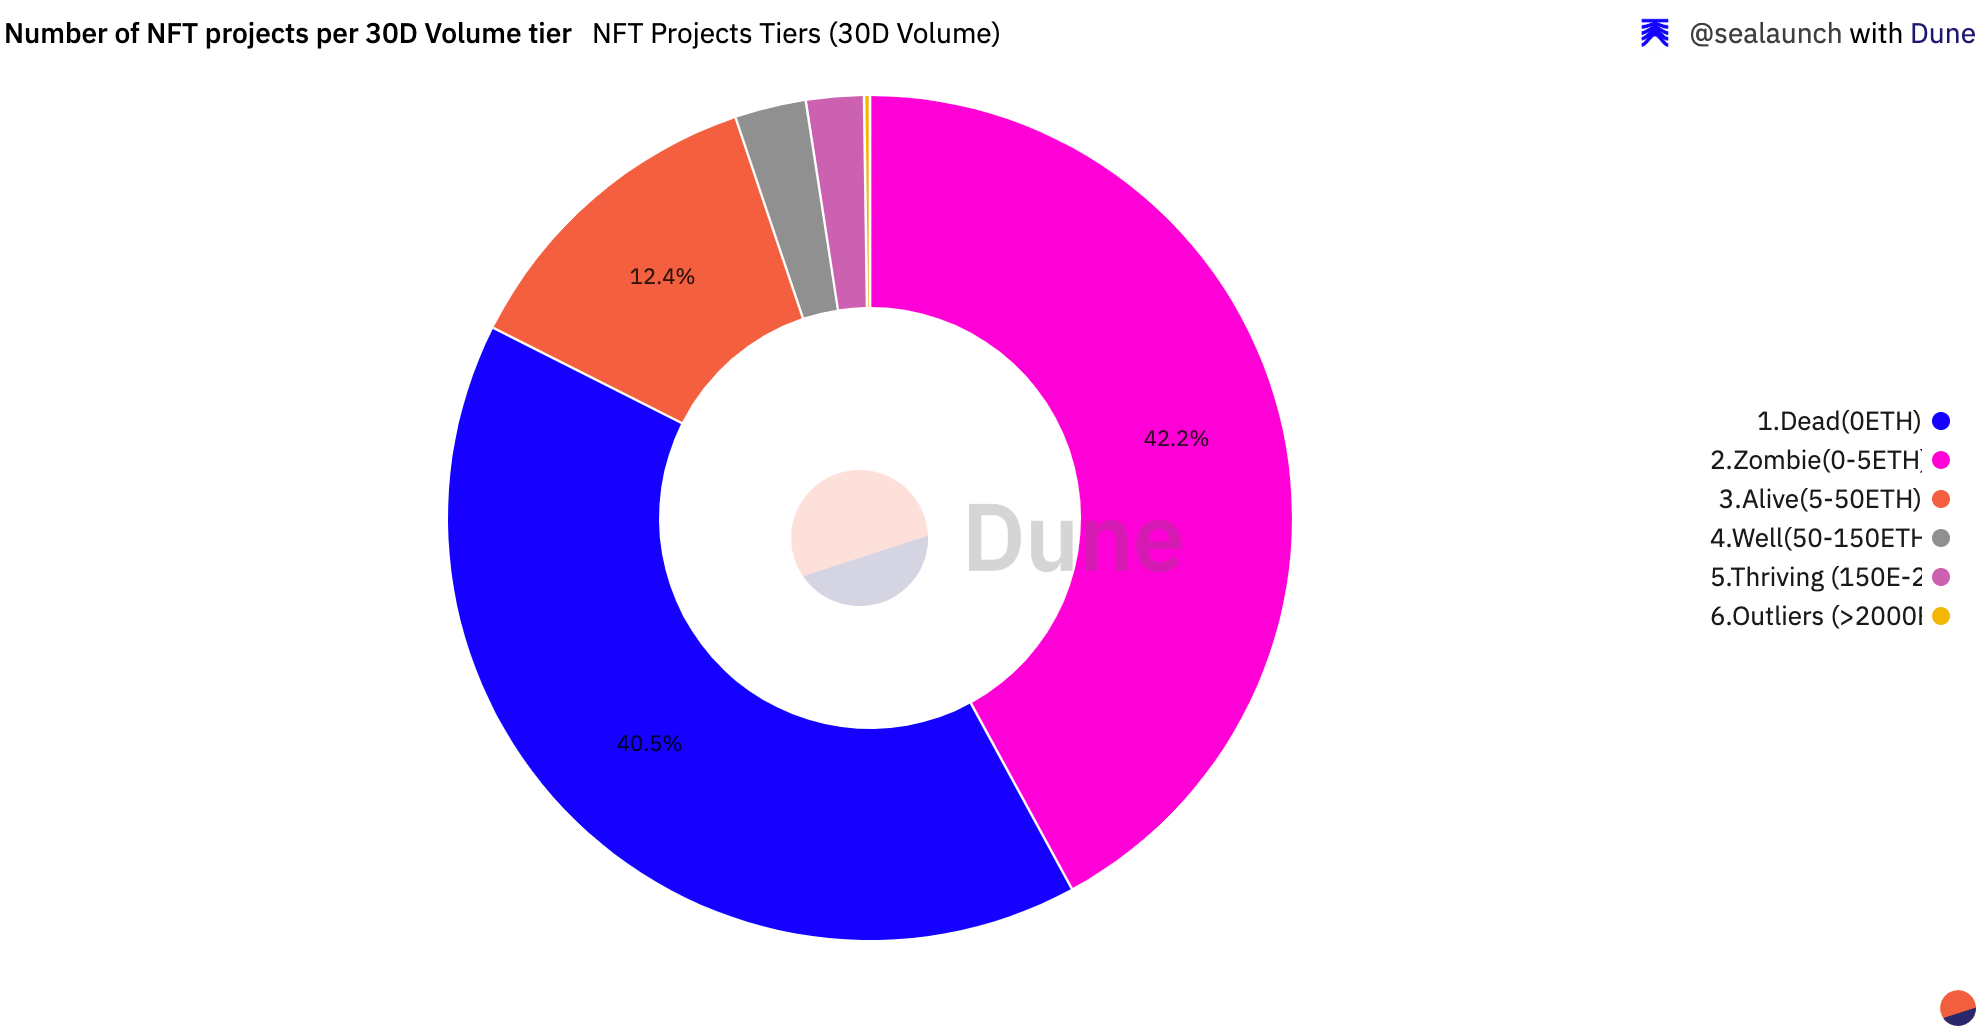
Most NFT collections in the market aren’t performing well in terms of volume.
The vast majority of launched NFTs since July 2021 are either Dead or Zombie with a volume below 5 ETH in the last 30 days. These 2 tiers account for ~83% of the NFTs on Ethereum.

In contrast, ~82% of the market’s volume is generated by NFT collections in the Thriving and Outliers tiers with a combined ~267K ETH (~420M USD) volume in the last 30 days.

19 Outliers NFT collections have a 43.3% slice of the Ethereum NFTs’ 30 day volume, a tally of 142K ETH (~ $225M USD).
Can dead NFT projects talk?
As we said before, for this analysis we call a dead NFT project i) a launched NFT project with ≧ 5 ETH all time volume but ii) with 0 ETH volume in the last 30 days.
Dead NFTs account for ~ 40% of ETH NFTs, so let’s see which insights we can find in the data.

More than half (~58%) of dead NFTs are on the lowest all time volume tier. These 3K collections never surpassed 20 ETH of all time volume.
From our perspective, some reasons that can explain this distribution:
Unscrupulous players trying to quickly cash in on the NFT craze by launching multiple projects to only rug pull the community;
NFTs are seen as short-term speculative asset with no long-term utility;
NFT teams with little incentive to actually carry out their proposed roadmap/vision after raising insufficient or little capital from the initial mint;
NFT communities had no mechanism or binding commitment to enforce NFT teams to carry out their proposed roadmap/vision after raising so much capital from the initial mint;
And finally, a lot of FOMO-driven decisions to put it simply.

Moreover, 672 NFT collections still generated ~470K ETH in secondary volume, even though that in the last 30 days did not attract any interest from NFT collectors or investors.
The bright side of NFT volume data.
Insights from Outliers NFT projects in this bear market.
Moving on to the bright side to crunch the data for the Outliers NFT projects in terms of the last 30 days volume.
Important reminder: the NFT market outliers (collections > 2K ETH last 30 days volume) consist of just 19 NFT collections. And, the highest 30D volume tier ( > 100K ETH) accounts for ~47% of the NFT market on the Ethereum blockchain.

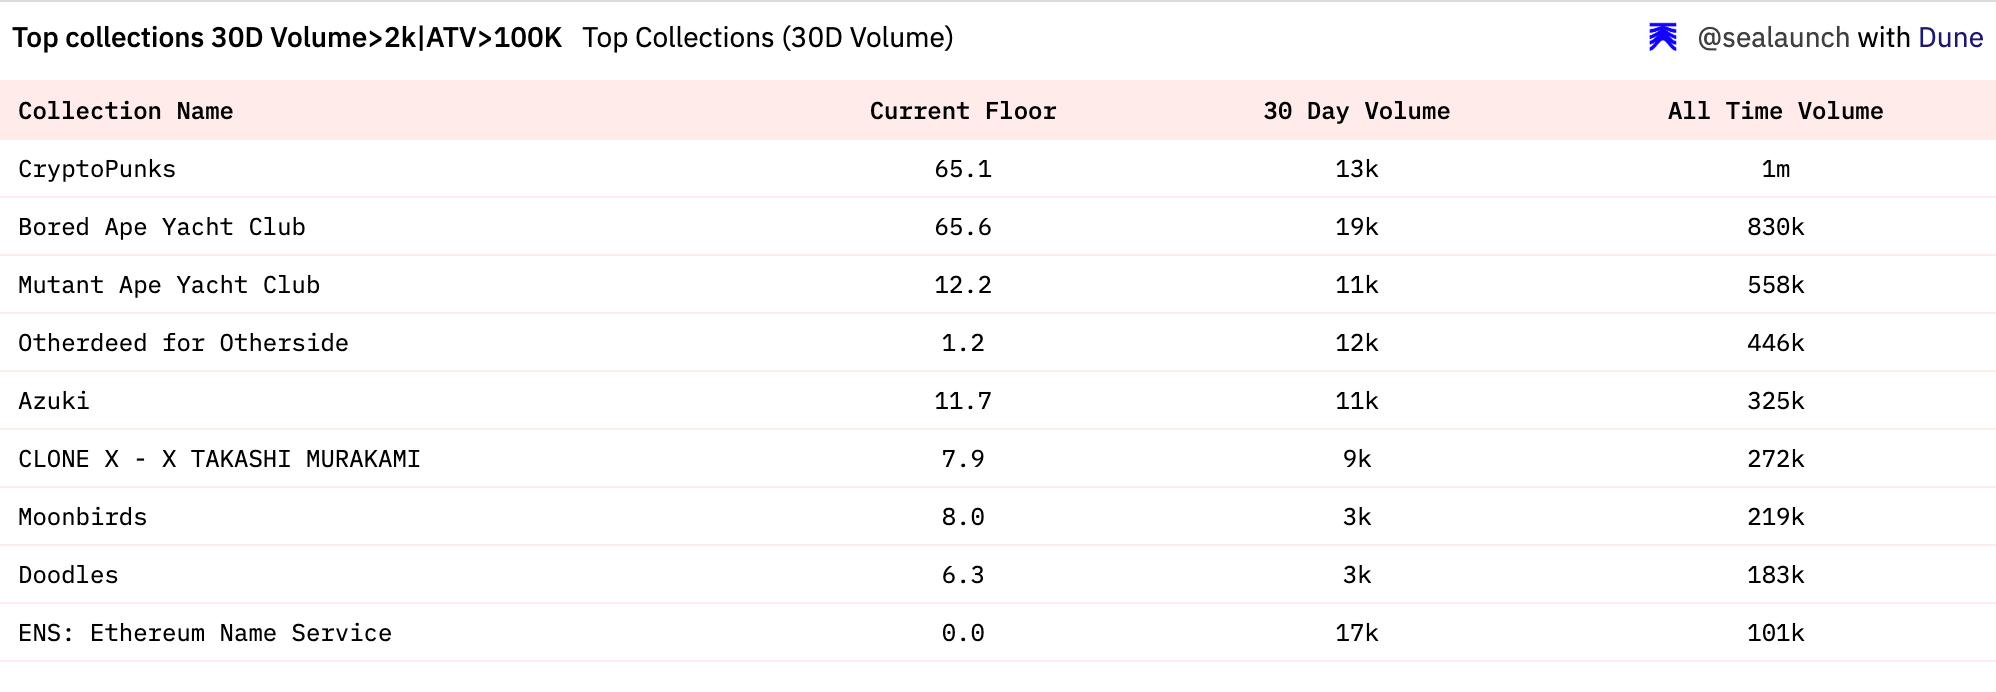
But, if you look at the chart below it notes that 9 out of 19 NFT projects (highest AT volume >100K ETH) represent ~97% of the volume in the last 30 days.

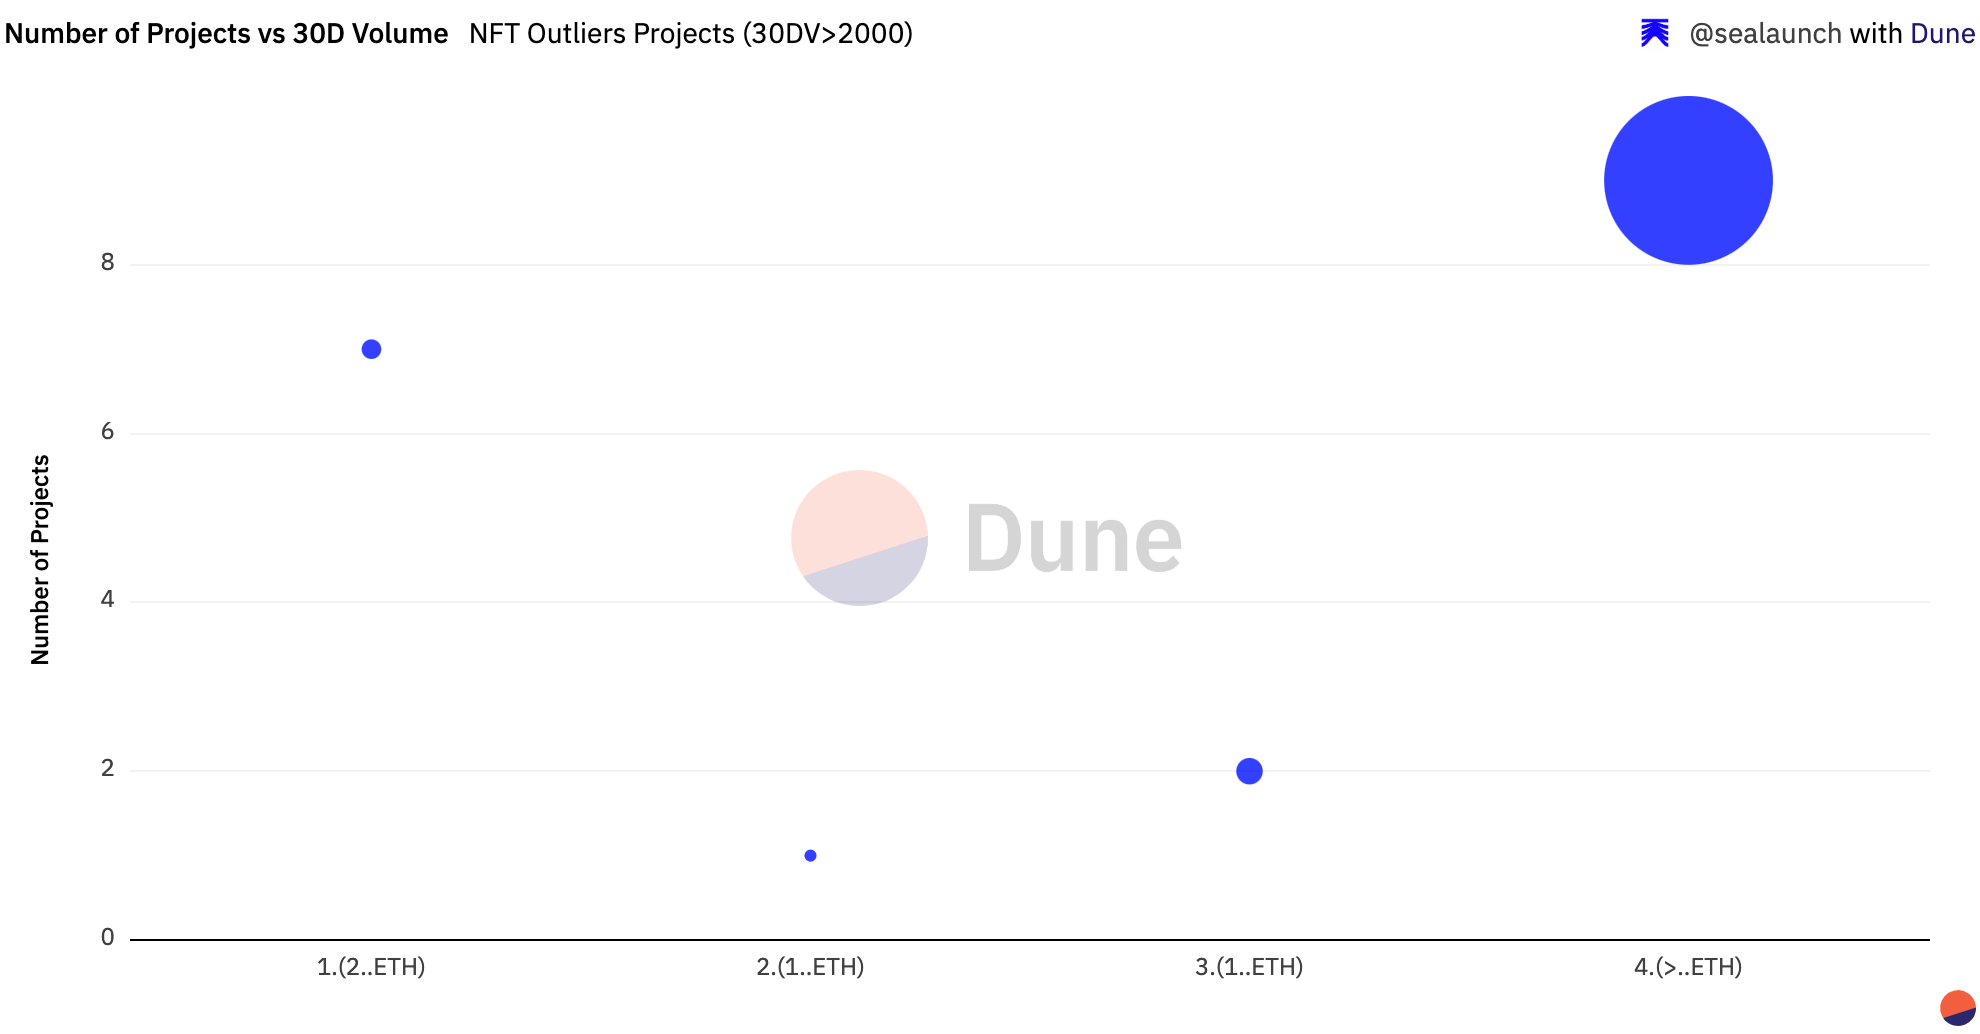
These 9 projects combined generated all time volume of 4M ETH (north of $6 Billion USD).
Some interesting side notes on these projects:
5 out of 9 Outliers NFT collections belong to the Yuga Labs, namely BAYC, MAYC, Otherdeed and CryptoPunks (acquired from Larva Labs).
The majority of collections on this list were launched before 2022:
5 out of 9 in 2021, namely BAYC, BAKC, MAYC, CloneX and Doodles;
ENS in 2019 when .eth registrar became an ERC721 compliant non-fungible token contract;
The OG CryptoPunks in 2017.
3 out of 9 Outliers NFT collections were launched in 2022: Azuki, CloneX and Moonbirds.
Going through the list above, it’s clear that NFT collections owned by Yuga Labs have had a historic impact on secondary market volumes.
For this reason, we’ve included all Yuga Labs owned collections, vg BAYC, CryptoPunks, Meebits, MAYC, Otherdeed for Otherside and BAKC in the next charts, even though Meebits and BAKC are not among the 9 Outliers NFT collection list.
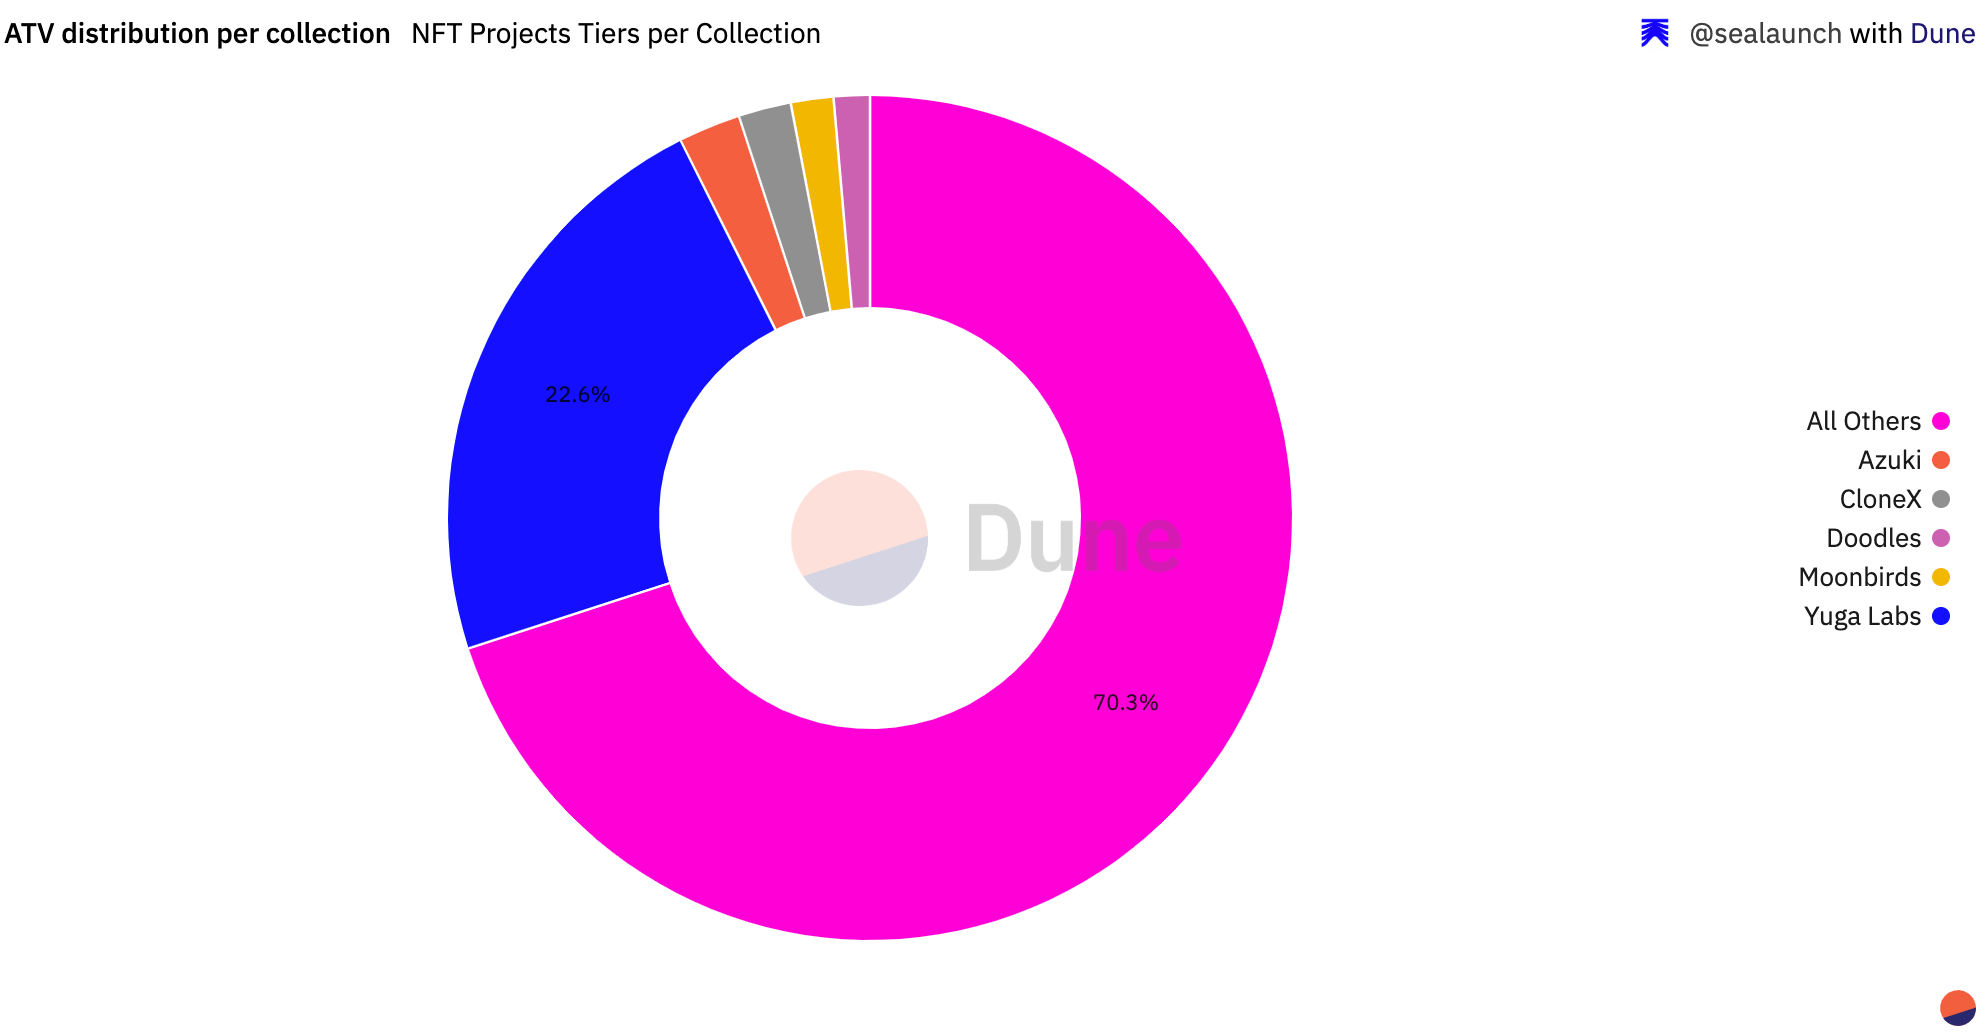
In fact, Yuga Labs owned collections account for ~20% of all time volume on the secondary market and, in the last 14 months, have been consistently accounting for 20% to 25% of this market.

What other metrics can be used to understand how the NFT market is performing besides secondary volume?
Since top NFT collections are the source of most of the secondary market’s volume, is the latter alone indicator enough of how’s the market performing? The short answer is no.
Secondary market volume can indicate how much ETH is being transacted in the NFT market. But, because top NFT collections (Yuga Labs owned mostly) are the ones originating most of the volume, what’s being measured is how much ETH top collections transact and not painting a whole picture for the total usage of the NFT market.
In this context, it also makes sense to look at other usage metrics, namely:
Number of sales;
Unique users.

Dune Analytics Number of Sales source and Unique Users source
The charts above show:
On par with NFT volume data, the number of sales and unique users decrease it’s proof that the NFT market has cooled down, but definitively the data does not indicates is a “dead” market;
Specifically, the number of sales per week:
The data shows the numbers have consistently been between 200k and 400k for a year now (the chart tracks data from October 2021 till now);
Although sales have been declining, it still accounts for ~100K users/week.
Even, if the volume has substantially lowered from all time highs, usage metrics (number of sales and active users) show that the NFT market is alive and users are sticking around.
Conclusion:
The NFT market has not escaped the overall macro bear environment. But, it’s far from dead when you look at volume, the number of sales and unique users’ data combined.
Key takeaways:
1/ Bear cycles help separate the wheat from the chaff. A significant chunk (~83%) of launched NFTs (≧ 5 ETH all time volume) is either dead or zombie with 0 ETH volume or below 5 ETH volume in the last 30 days.
2/ The current macro bearish times are hard on upcoming NFT projects. Taking account OS’ volume data plateau, it indicates that NFT teams will have less funds available to fulfill their vision and proposed roadmap.
3/ It will be challenging for new NFTs collection to dethrone any of the top NFT collections, especially the Yuga Labs owned collections which have between 20-25% market share in the past 14 months, but Moonbirds is an example of how new collections can get to blue-chip status.
4/ The market is less crowded with speculators, even though they have not exited the room. NFT projects will need strong value propositions, compelling NFT use cases or solid new tech to attract new users, but above all to have long term user growth to keep them afloat till a new hype cycle begin bringing back attention, money and users with it.
To end on a positive note, if you zoom out the NFT summer was in 2021 and the NFT all time high at the beginning of 2022. Everything in the NFT space seems to go really fast, but the market it’s still in its infancy and there is a lot of untapped potential in NFTs to be unlocked in the upcoming future.
TL;DR
Are NFTs dead? We looked for answers in Opensea’s volume data - a good barometer for the overall NFT market performance:
Opensea’s volume plateaued in the last 4 months = NFTs are going through a bear market much like the rest of the crypto market;
Although OS volume has dramatically decreased, it is still one of the biggest revenue-generating companies in web3 and a major player in the NFT market, so it’s safe to say that NFT are not dead.
In spite of that, what is the state of NFTs?
1/ Failed NFTs - projects with insignificant all time volume between 0 and 5 ETH represent +70% of the projects deployed on Ethereum since NFT summer;
2/ ~25% NFTs successfully launched (≧ 5 ETH all time volume), so we looked at the last 30 days volume and found:
83% of NFTs are either Dead (~40%) or Zombie (~42%), meaning a majority of projects had no volume or below 5 ETH volume in the last 30 days;
In contrast, 82% of the market’s volume is generated by NFT collections in the two higher volume tiers (+150 ETH in the last 30D volume).
3/ If dead NFT projects could talk, what are would they say?
3K NFT collections = more than half (58%) of dead NFTs never surpassed the 20 ETH all time volume mark;
Still, +600 NFT projects generated 472K ETH in secondary volume, even though they generated 0 volume in the last 30 days.
4/ On the opposite extreme, Outliers NFTs’ volume (collections > 2K ETH All time volume) inform us that:
NFT market’s Outliers consist of just 30 NFT collections and 9 out of 19 account for 47.4% of the NFT market on the Ethereum blockchain;
5 out of 9 Outliers NFT collections belong to the Yuga Labs, namely BAYC, BAKC, MAYC, Otherdeed for Otherside and CryptoPunks;
Yuga Labs owned collections account for ~20% of all time volume on the secondary market.
5/ Combining volume data with the number of sales and unique users’ data helps to have a clear picture of the NFT market as a whole, less influence by Yuga Labs volume dominance:
Even with volume down, usage metrics indicate that the NFT market is alive and users are sticking around during the bear cycle.
6/ Conclusions:
The NFT market follows the macro bear trend, which is good to clean up the NFT space from opportunistic and weak NFT projects;
Under current market conditions, there will be fewer funds available for upcoming NFTs to build their vision and roadmaps;
It will be a challenge to dethrone top NFT collections, but Moonbirds NFT has proven that is not impossible;
NFT teams will need strong use cases, tech and vision to have long-term user growth to keep them alive through this bear cycle;
We are still in the early days of NFTs, NFT summer was last year (2021), and there is a lot of potential to be unlocked in the future.