
The Yield Your Stablecoins Aren't Earning


Stablecoins are a $300 billion economy as of March 2026. Most of that capital is earning nothing.
Gauntlet published data in August 2025 showing that only $6.78 billion USDC was deployed in DeFi across Ethereum, Arbitrum, Base, and Solana. Roughly $46 billion USDC, 68% of supply, was sitting idle. USDC is less than half of USDT’s market cap. These two stablecoins alone make up ~87% of the market. Neither is natively yield-bearing. Every holder parking them on a CEX is funding Tether and Circle’s margins without capturing any of the upside.
The yield infrastructure to fix this exists, and it has been through multiple market cycles.
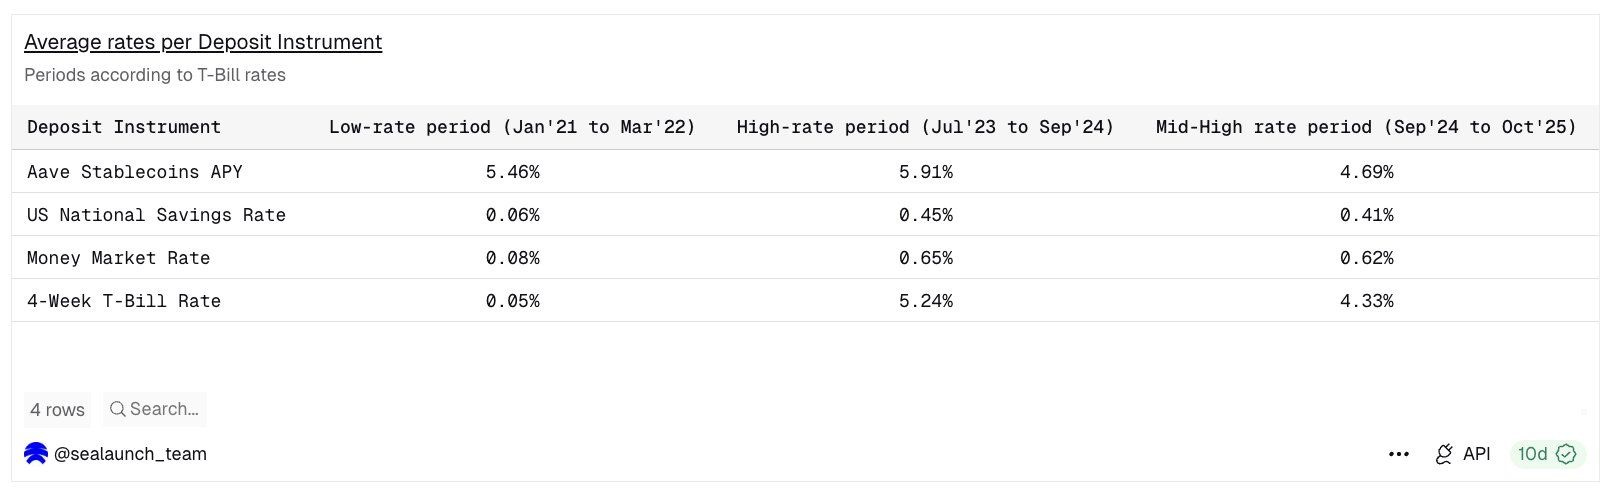
We ran a historical analysis of Aave stablecoin APYs against US T-Bills, the National Savings Rate, and the Money Market Rate. Across every rate regime since 2021 (low, high, and mid-high) Aave stablecoins outperformed. During the low-rate period (Jan’21 to Mar’22), Aave yielded 5.46% while T-Bills returned 0.05%. During the high-rate period (Jul’23 to Sep’24), Aave returned 5.91% against T-Bills at 5.24%. The spread isn’t a few basis points. It’s consistent across cycles.
For institutional allocators, traditional funds, and family offices seeking digital asset exposure without taking on directional risk, this matters. Stablecoins with yield are a genuinely compelling instrument, if you know where to look and how to assess the risk.
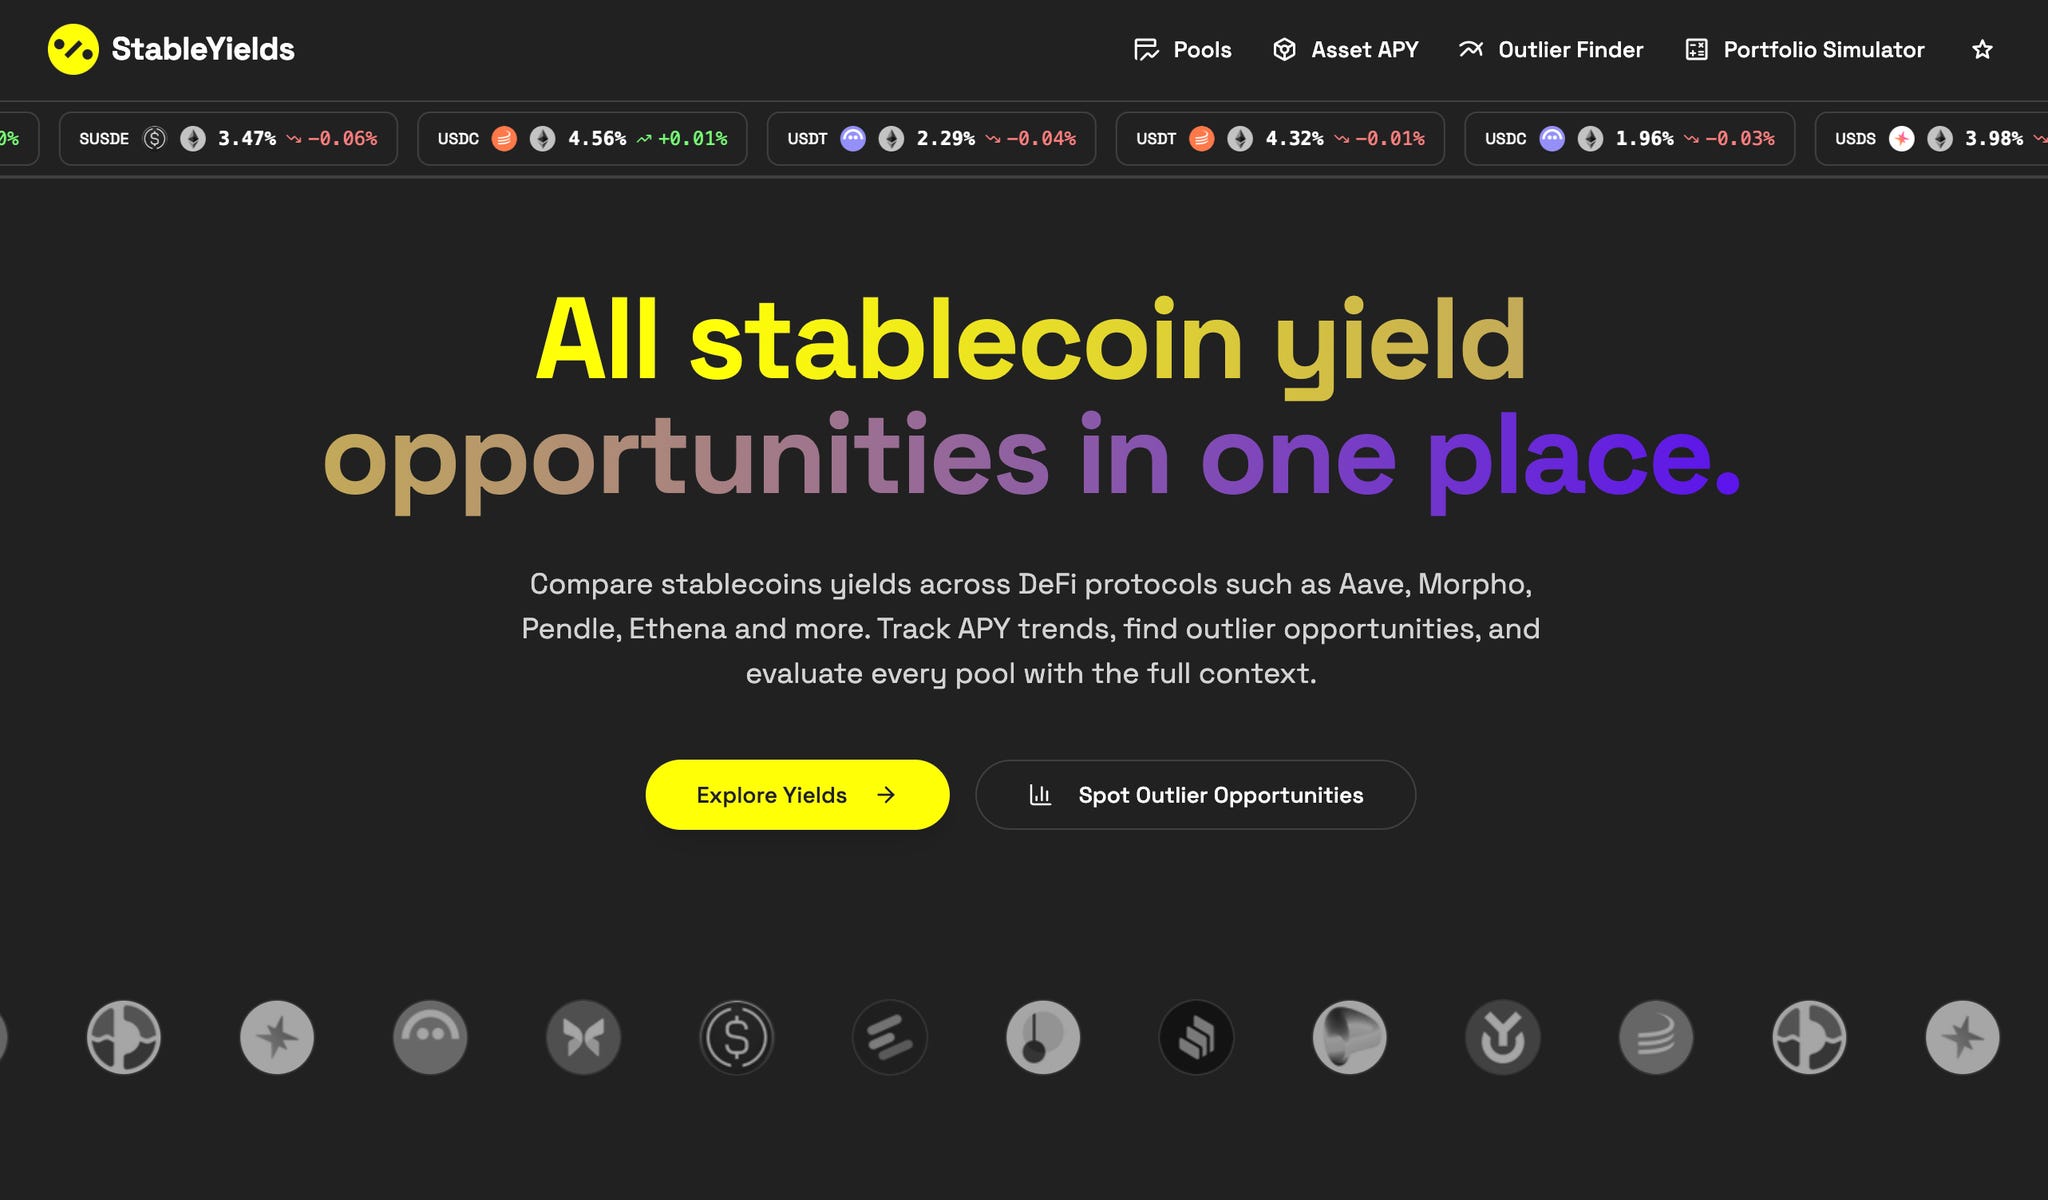
That’s exactly what Stable Yields is built for. The platform aggregates data from DeFiLlama, FRED, ECB, and proprietary Sealaunch Intelligence into a single interface, so the context needed to act is already there.
Why we built StableYields.
Finding risk-adjusted onchain yield is a job. Most tools give you a headline APY. None of them give you the full picture. Here is what that picture actually requires.
Base APY vs. reward APY. A pool at 12% and a pool at 4% are not simply better and worse, they are different bets. If 10% of that 12% comes from reward token emissions, the rate collapses the moment incentives end. A pool at 4% base APY with a flat 30-day trend is a structural position. Separating base from reward is the first filter between durable yield and mercenary capital.
TVL as a proxy, not a guarantee. A $500M pool on Aave carries a different risk profile from a $2M pool on a newly deployed vault. It also has different operational implications: the Aave pool can absorb a $5M position without moving the rate; the $2M pool cannot. Entry compresses the yield, exit may not be clean. TVL informs execution as much as it signals safety.
The underlying asset. Not all stablecoins are equal. Fiat-backed stablecoins (USDC, USDT) carry custodial and regulatory structure. Crypto-backed and delta-neutral stablecoins (DAI, USDe) introduce liquidation and funding rate exposure that behaves differently in volatile markets. Newer yield-bearing stablecoins bake the strategy into the asset itself, which means the yield source and the asset risk are the same thing.
Yield source determines durability. Lending fees and liquidation revenue exist as long as there is borrowing demand, suitable for longer-term passive positions. Reward emissions are time-limited by design, compressing when incentives end. RWA coupons are predictable but slow-moving, best for allocators optimizing for consistency over upside. The source tells you how long the yield lasts.
Yield has a stack, and so does risk. A vault depositing into a Morpho market inherits that market’s risk and adds its own on top. A structured product executing leverage on a lending pool compounds both. The further the yield source is from the base protocol, the greater the accumulated risk. Steakhouse for example rates every vault from AA down to C based on the weakest link in that stack, asset quality, platform strength, liquidity, and collateral conditions.
That’s why we built Stable Yields. One place to compare every major stablecoin pool and yield vault across every relevant protocol, with the context to act on it.
Earn yield on stablecoins, whatever your risk profile.
The TradFi Capital Allocator that needs to beat the T-bill, defensibly.
A CIO or portfolio manager at a single-family office or boutique crypto fund running a digital asset sleeve. AUM in the $100M to $500M range, stablecoin position between $500K and $20M. According to a BNY Wealth survey, 74% of family office professionals are now invested in or actively exploring crypto. Their benchmark is simple: credible yield above the 10Y Treasury (currently 4.3%), from audited, large-cap protocols, with minimal operational overhead.
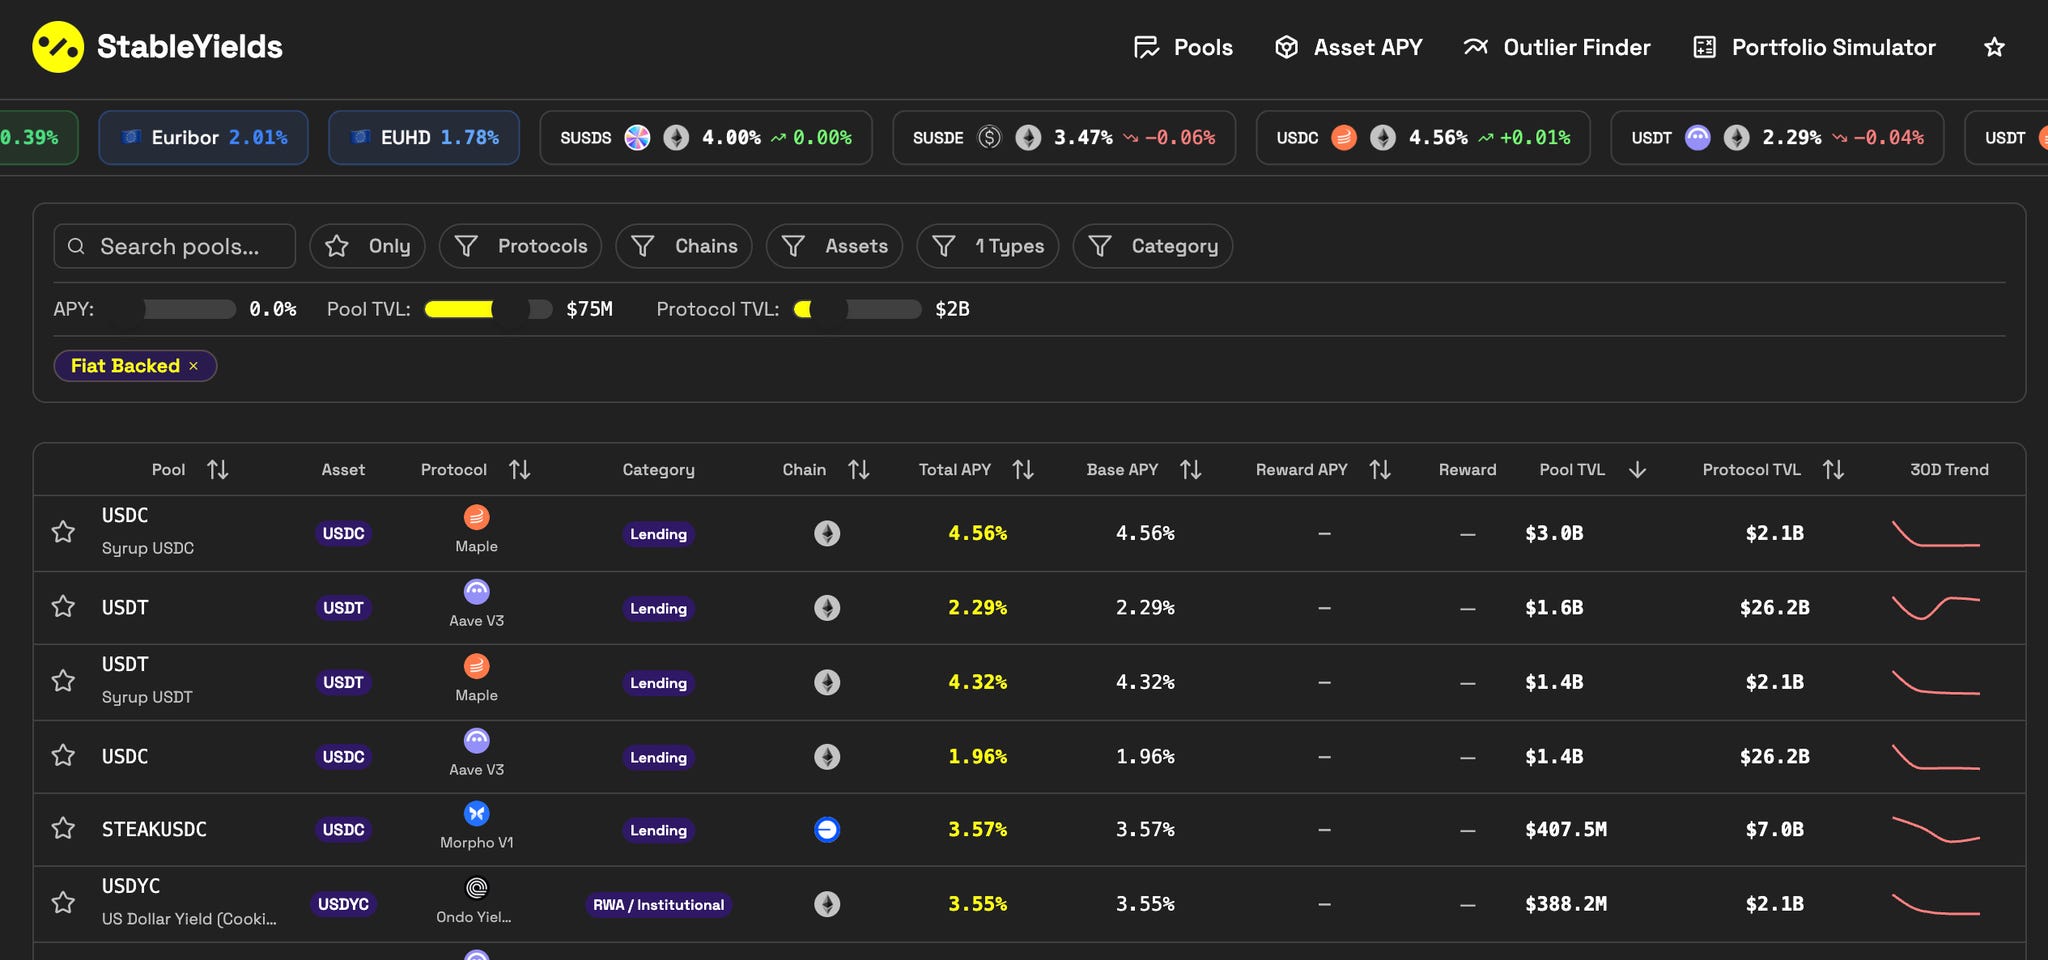
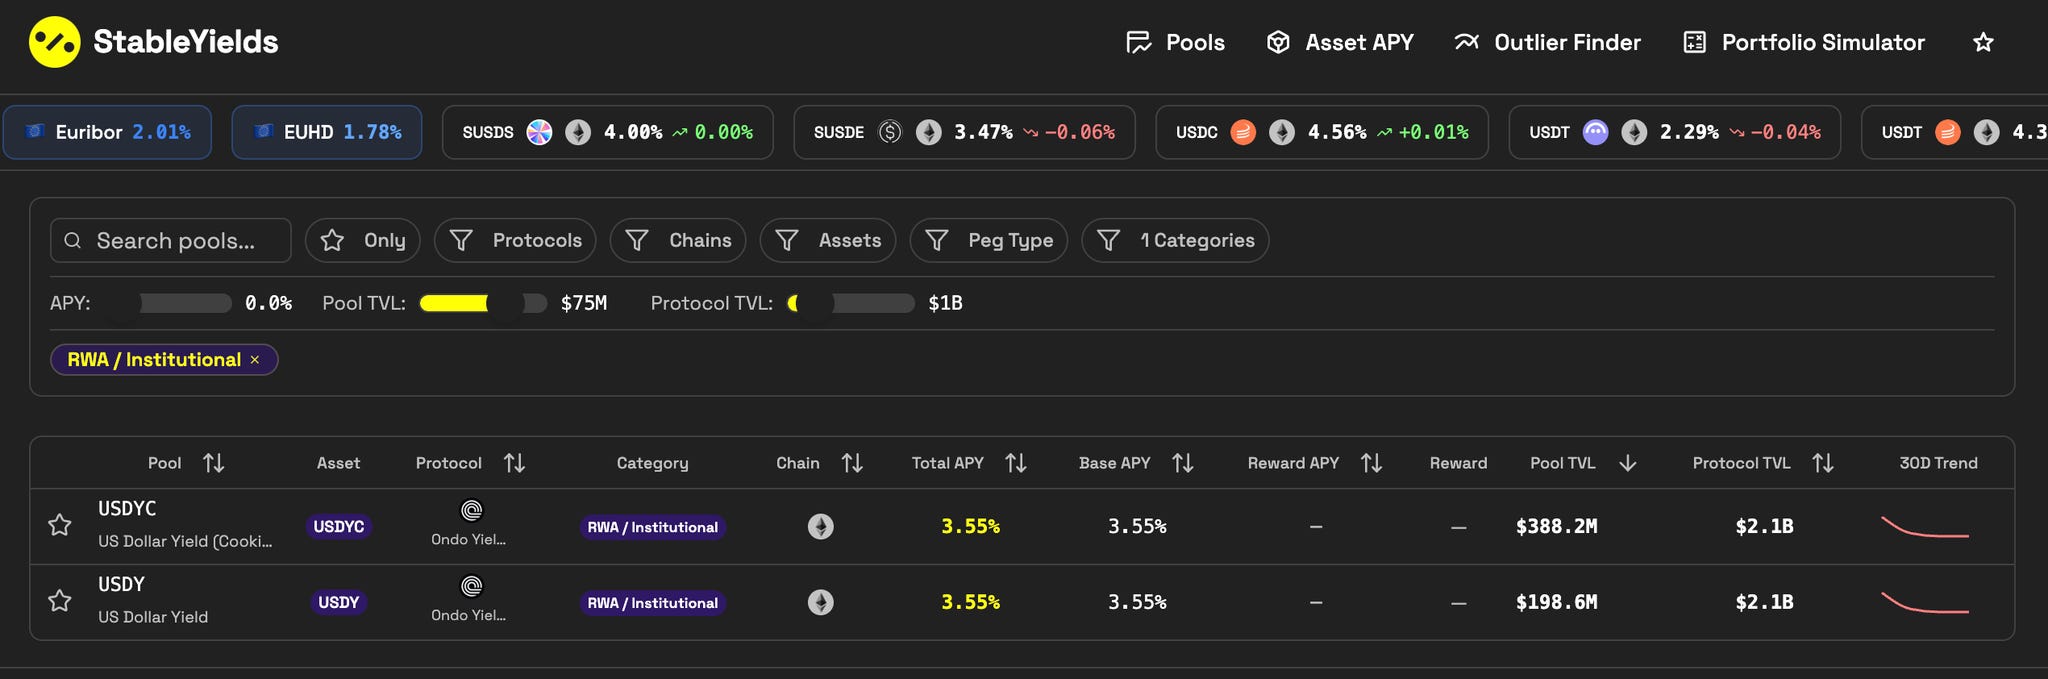
On StableYields, the filter is straightforward: fiat-backed stablecoins only, minimum pool size $75M, protocol TVL above $2B. Those three constraints eliminate noise and leave only deep, institutional-grade liquidity in assets with the simplest risk profile. The result: Maple’s Syrup USDC at 4.56% base APY sits at the top of the list, lending yield inside a protocol with $2.1B TVL. It clears the T-bill benchmark with a 26 basis point spread and zero reliance on incentives to hold the rate.
The Onchain Capital Allocator looking for structural edge.
A vault curator or DeFi manager behind yield-bearing stablecoins and institutional lending products. Deployed capital ranges from $10M to $500M+. Reallocation decisions happen weekly as rate differentials shift. Some are also running 2x to 3x leverage loops on Aave to amplify base APY.
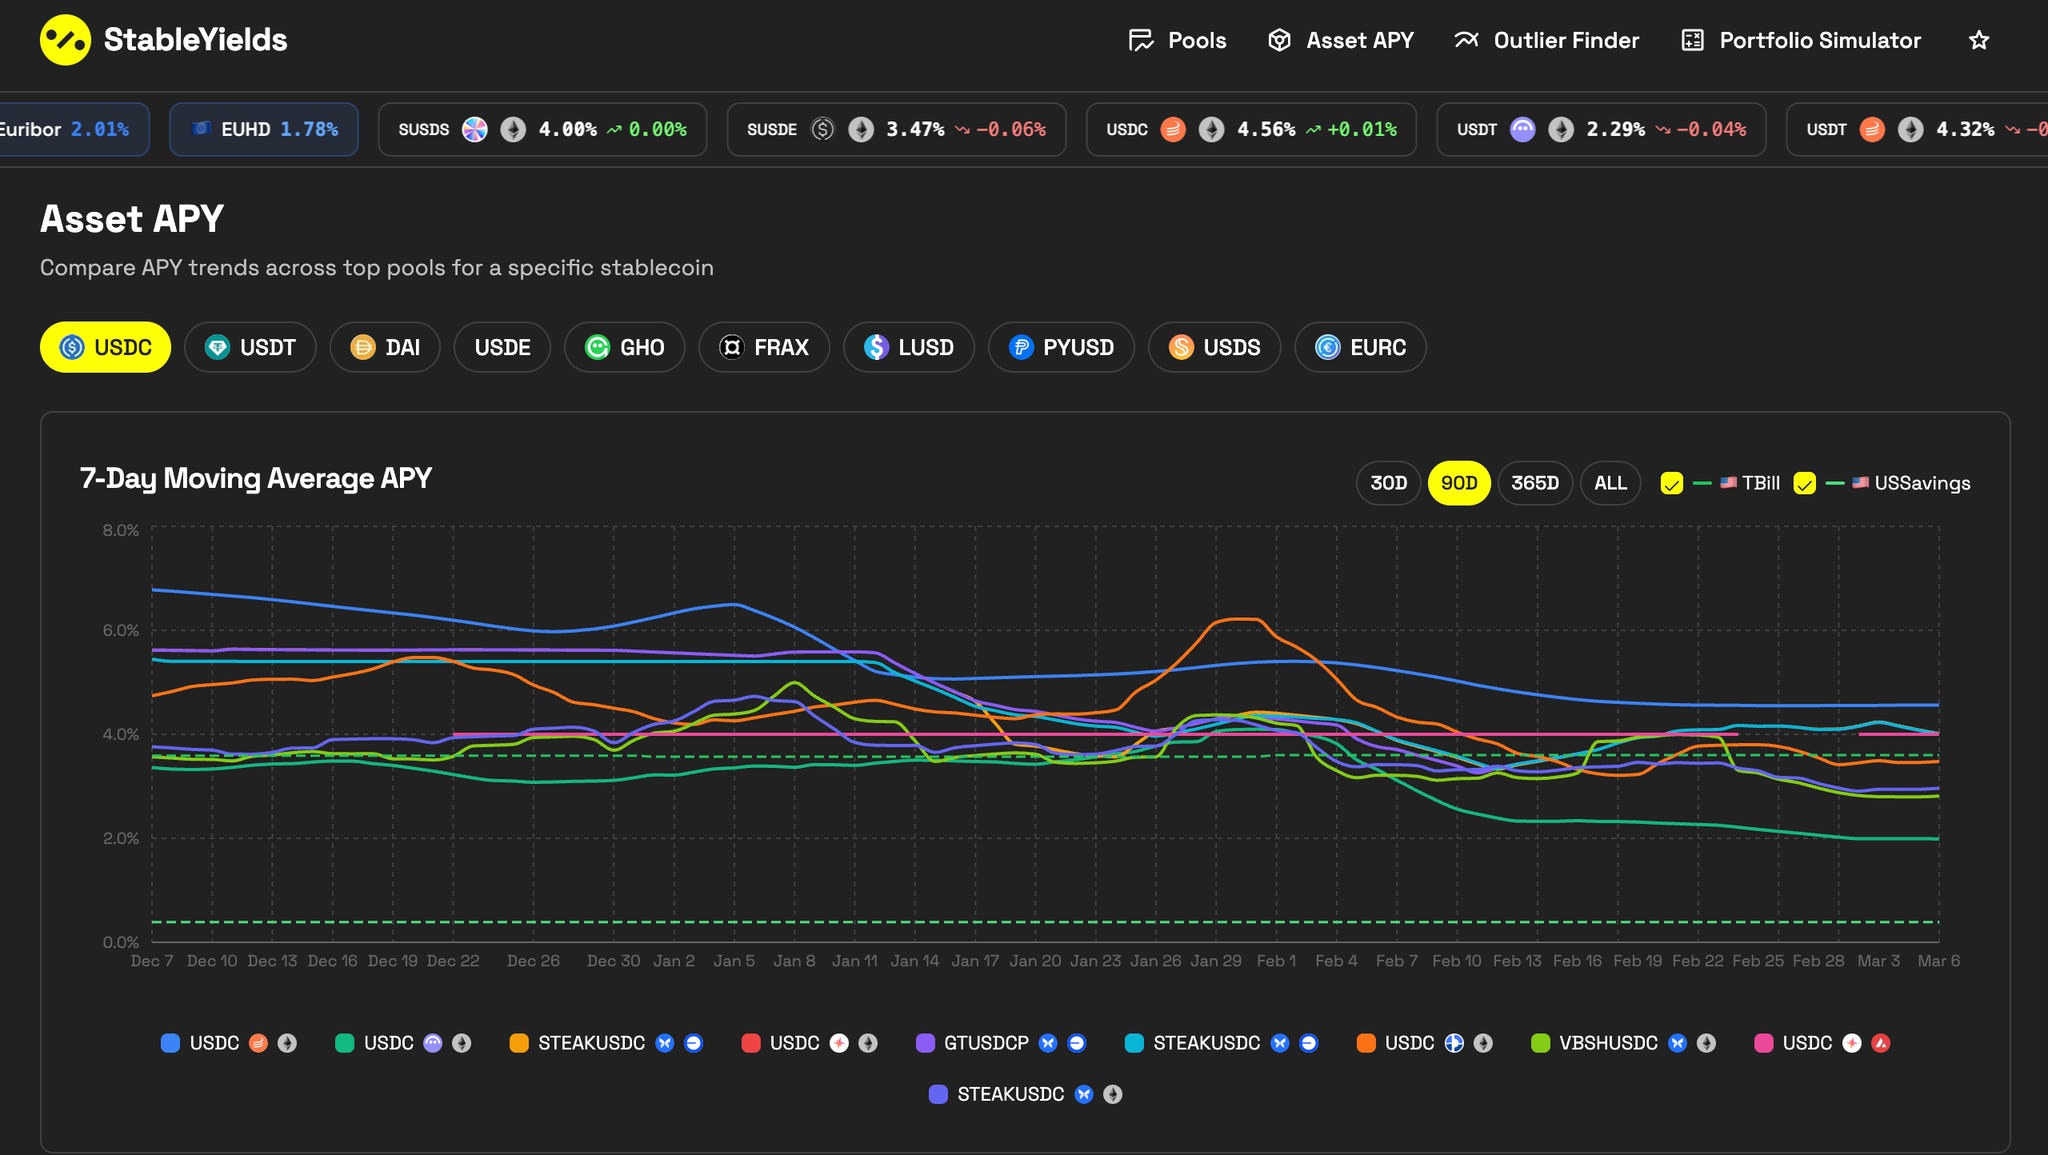
The Asset APY tab gives them a 7-day moving average across all USDC pools in a single chart, with T-bill and US Savings rates overlaid as benchmarks. They can immediately assess whether a given pool’s rate has been stable for 30, 90, or 365 days, and whether it’s holding above or compressing toward the risk-free rate.
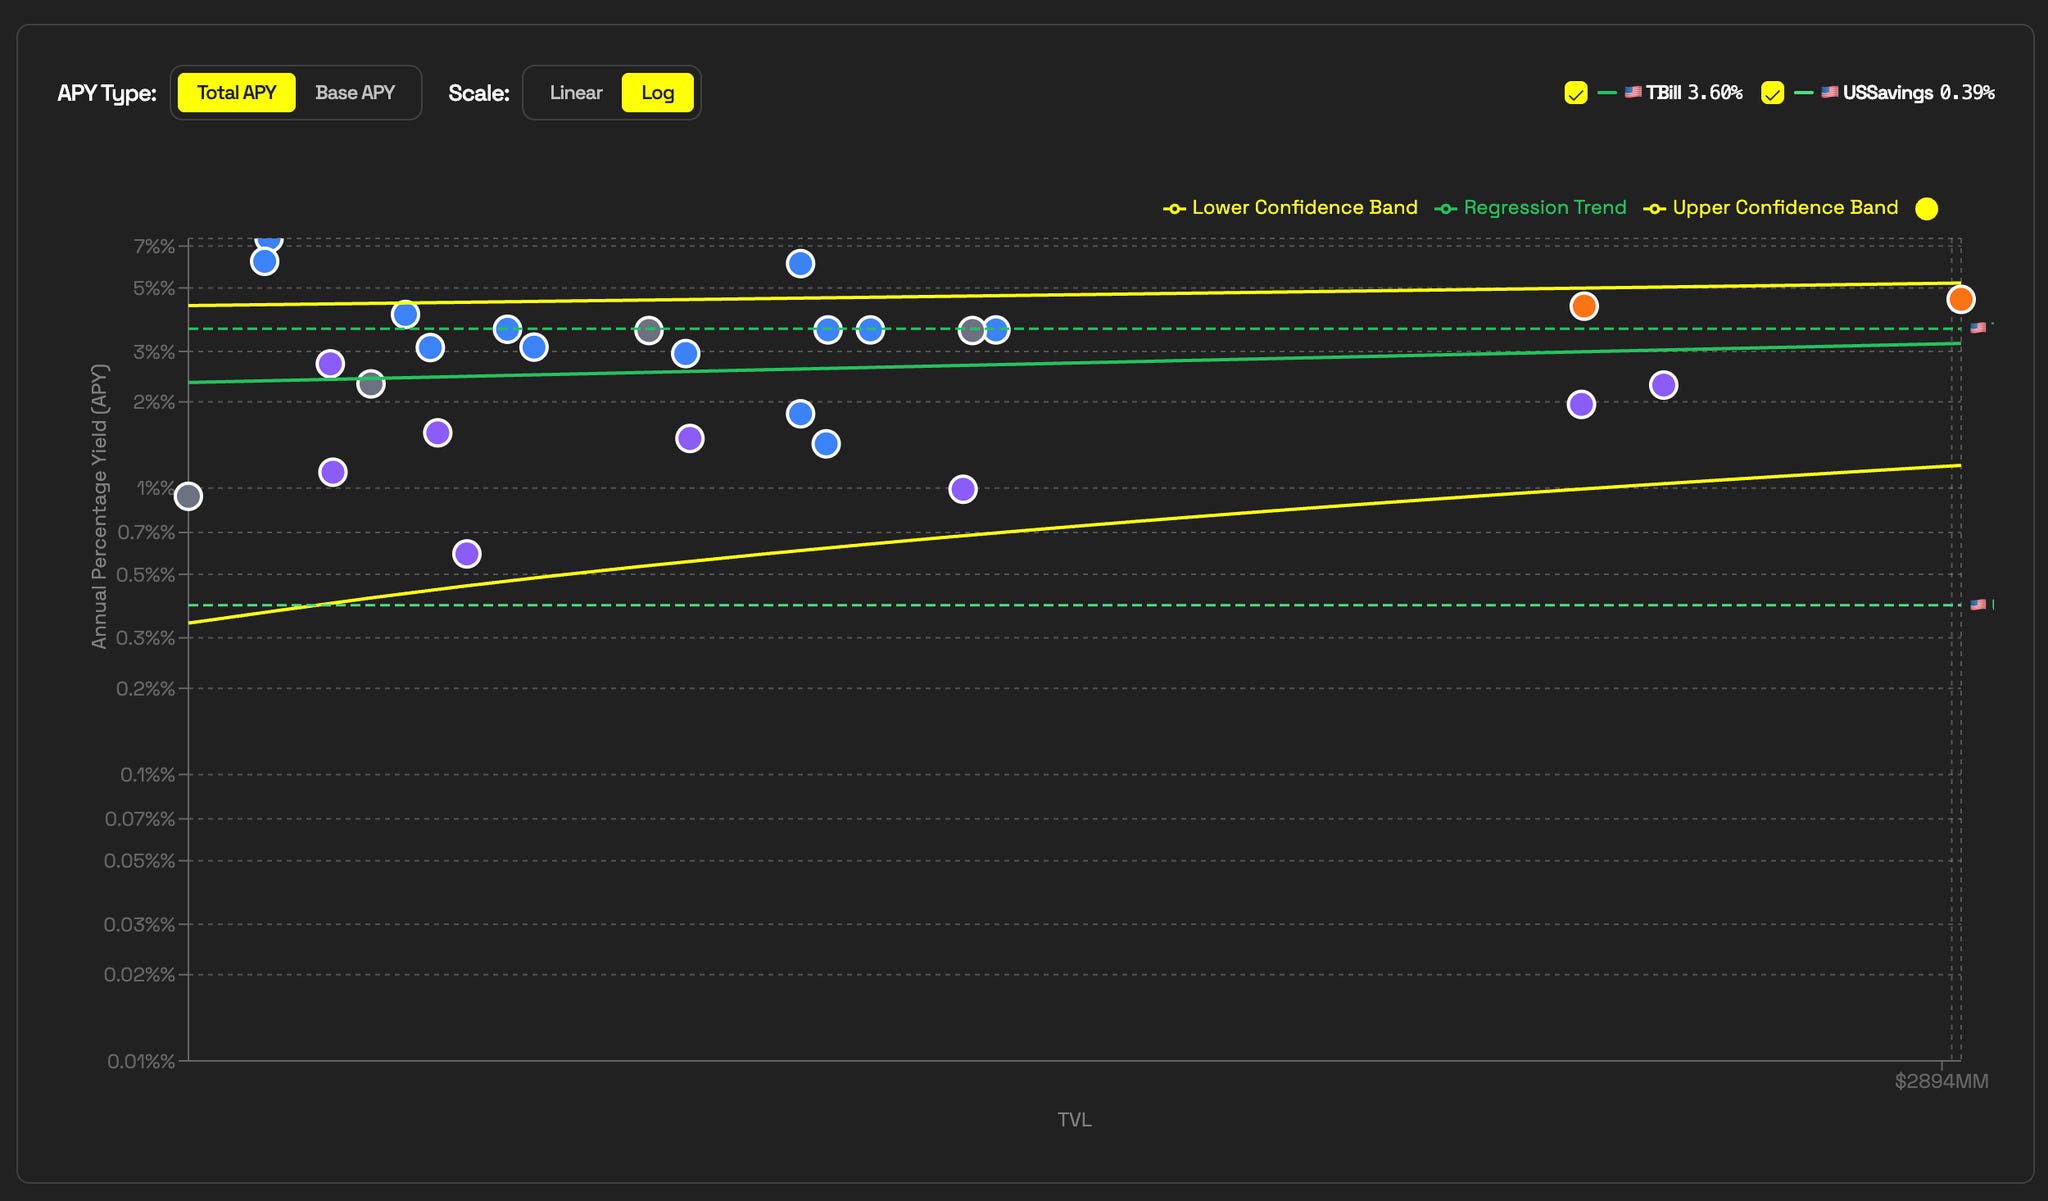
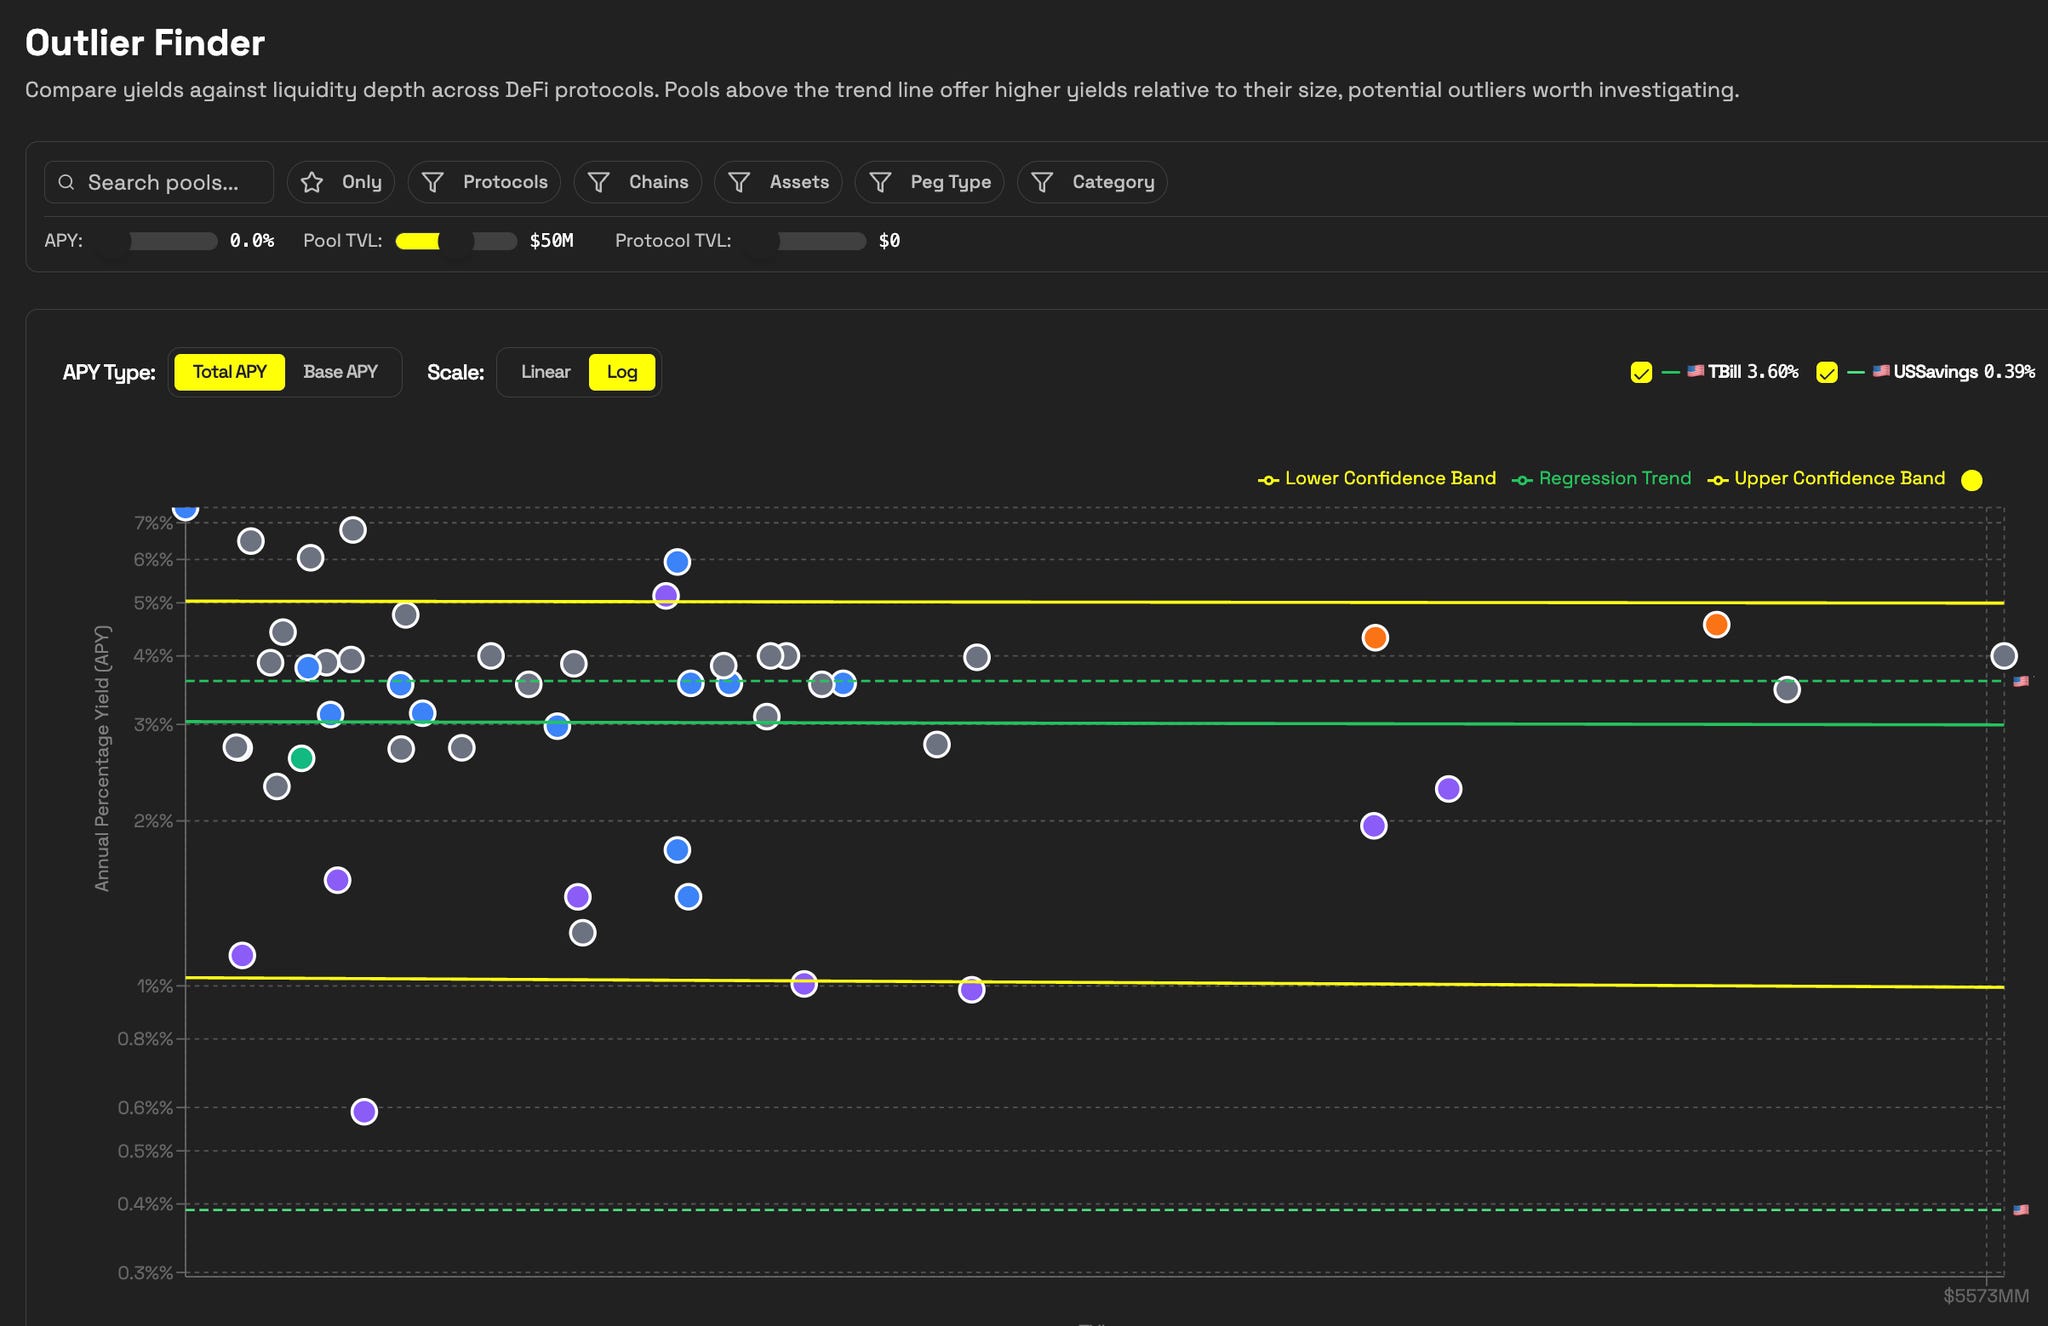
For deeper analysis, the Outlier Finder maps every pool on an APY vs TVL regression, again with T-bill and US Savings as reference lines. Pools above the regression line are yielding more than their liquidity depth implies, structural outliers worth investigating.
For looping, the workflow is: find a pool with low current utilization and a stable base APY above 3%, confirm it sits on the regression line rather than above it (above suggests imminent compression), then build the leveraged position knowing the rate has depth behind it. Stable Yields doesn’t execute the trade. It gives you the confidence to size it.
The institution coming to crypto wants deep liquidity and RWA exposure.
Asset managers, bank treasuries, and TradFi companies exploring onchain yield at $5M to $100M+ with a clear preference for RWA-backed instruments and regulated stablecoins. The target is consistent base APY in the 3.5% to 4% range, from a protocol with a long track record and deep enough liquidity to absorb the position without moving the rate. Reward tokens are not the goal.
On the Pools tab, filtering by RWA / Institutional category surfaces exactly this universe. Ondo’s US Dollar Yield pools come in at 3.55% base APY with $388M and $198M in pool TVL on a $2.1B protocol, no reward emissions, no rate volatility from incentive cycles. For European allocators benchmarking against Euribor at 2.01%, that’s 154 basis points of structural spread in a regulated instrument.
The yield farmer: mercenary capital on a quest to maximize yield.
A DeFi-native individual or small fund deploying $10K to $500K. Capital moves daily or weekly toward the highest total APY. But even mercenary capital needs a fast risk check: a pool at 12% total APY with 1% base is 91% dependent on a reward program continuing. A pool at 8% with 4% base is a fundamentally different bet. The composition matters as much as the headline number.
In the Outlier Finder, the edge is structural. Pools above the regression line are yielding more than their TVL implies, some currently sitting at 6% to 7% APY against a T-bill benchmark of 3.60%. Those are the entries. The 30-day sparkline on the Pools tab is the exit signal: when the trend turns, the incentive cycle is ending and it’s time to rotate.
More features for data-driven stablecoin yield decisions.
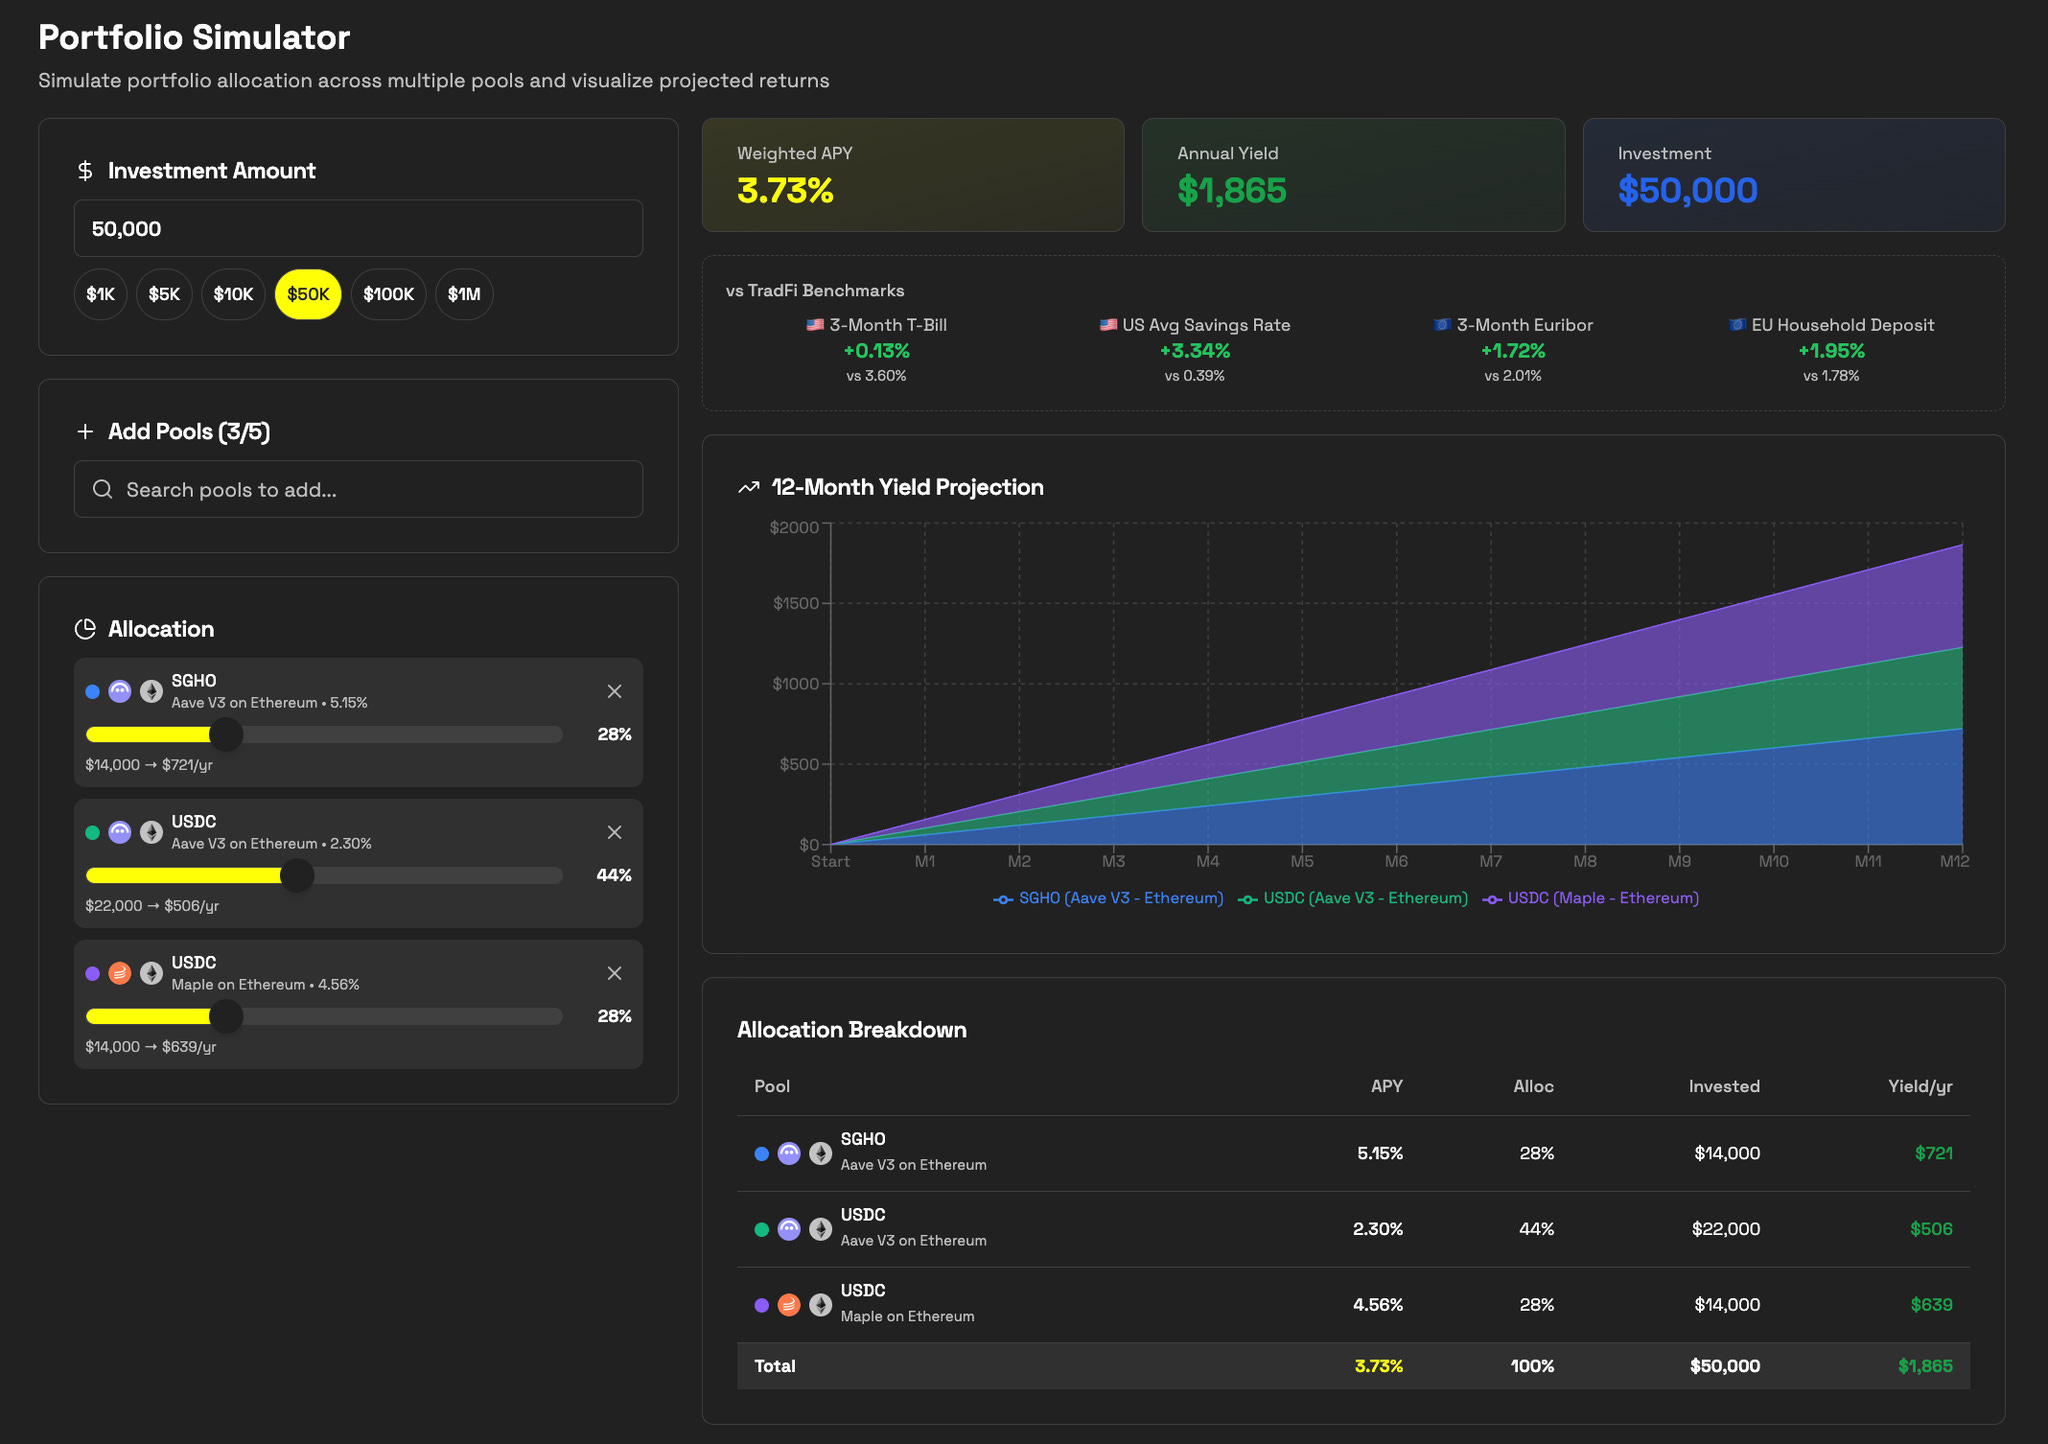
The Portfolio Simulator converts abstract APY comparisons into concrete dollar outcomes. Allocate capital across up to five pools, adjust the weights, and get an instant 12-month yield projection across your aggregated position.
In the example below, a $50,000 allocation split across three pools: SGHO on Aave V3 at 5.15% (28%), USDC on Aave V3 at 2.30% (44%), and USDC on Maple at 4.56% (28%). The blended result is a weighted APY of 3.73% and $1,865 in projected annual yield. Every allocation is benchmarked in real time against four TradFi reference rates: the 3-month T-bill (3.60%), US Average Savings Rate (0.39%), 3-month Euribor (2.01%), and EU Household Deposit rate (1.78%). The 3.73% weighted APY clears all four benchmarks simultaneously.
The use case is straightforward: before moving capital, model the portfolio. See the blended rate, the annual dollar yield and exactly how it stacks up against doing nothing in TradFi. The answer is in one screen.
Stable Yields surfaces and benchmarks the data. It does not eliminate the need for your own due diligence. Every pool carries risk and no tool removes that. What it does is cut the time it takes to find the right questions.
Key Takeways
Over 68% of USDC supply sits idle while Tether and Circle collect ~$9B per year in reserve yield from that exact capital. The stablecoin market is $300 billion. Most of it is earning nothing.
The opportunity cost is structural, not marginal. But no yield is equal and neither is your risk profile. Finding risk-adjusted opportunities requires knowing how to read imperfect metrics like APY and TVL as real signal, not face value.
The asset determines the floor risk. USDC and USDT carry different regulatory and custodial structures. DAI, USDe, and newer stablecoins introduce crypto-backed or delta-neutral mechanics with different risk and return profiles.
A 15% pool where 90% comes from reward emissions is a different bet from a stable 4% base APY with a flat 30-day trend. The underlying asset, TVL depth, and yield source change what the APY actually means.
Deeper pools attract more capital because more participants have collectively decided the risk is acceptable. That is a signal, not a guarantee.
The further the yield source is from the base protocol, the more can go wrong between you and your capital. Lending fees, reward emissions, RWA coupons, and leveraged structures carry different risk vectors and are not equivalent yield sources.
Stable Yields does not replace due diligence. It compresses the research. Pool filters by TVL, chain, and asset surface defensible rates fast. Asset APY shows the 30-day trend so you know if a rate is structural or a spike. Outlier Finder maps every pool against a TVL regression to flag yield above what liquidity depth implies. Portfolio Simulator turns any allocation into a dollar yield projection benchmarked against T-bill, Euribor, and US Savings in real time.
Data sources: Sealaunch Intelligence, DeFiLlama, FRED, ECB, Gauntlet, BNY Wealth.